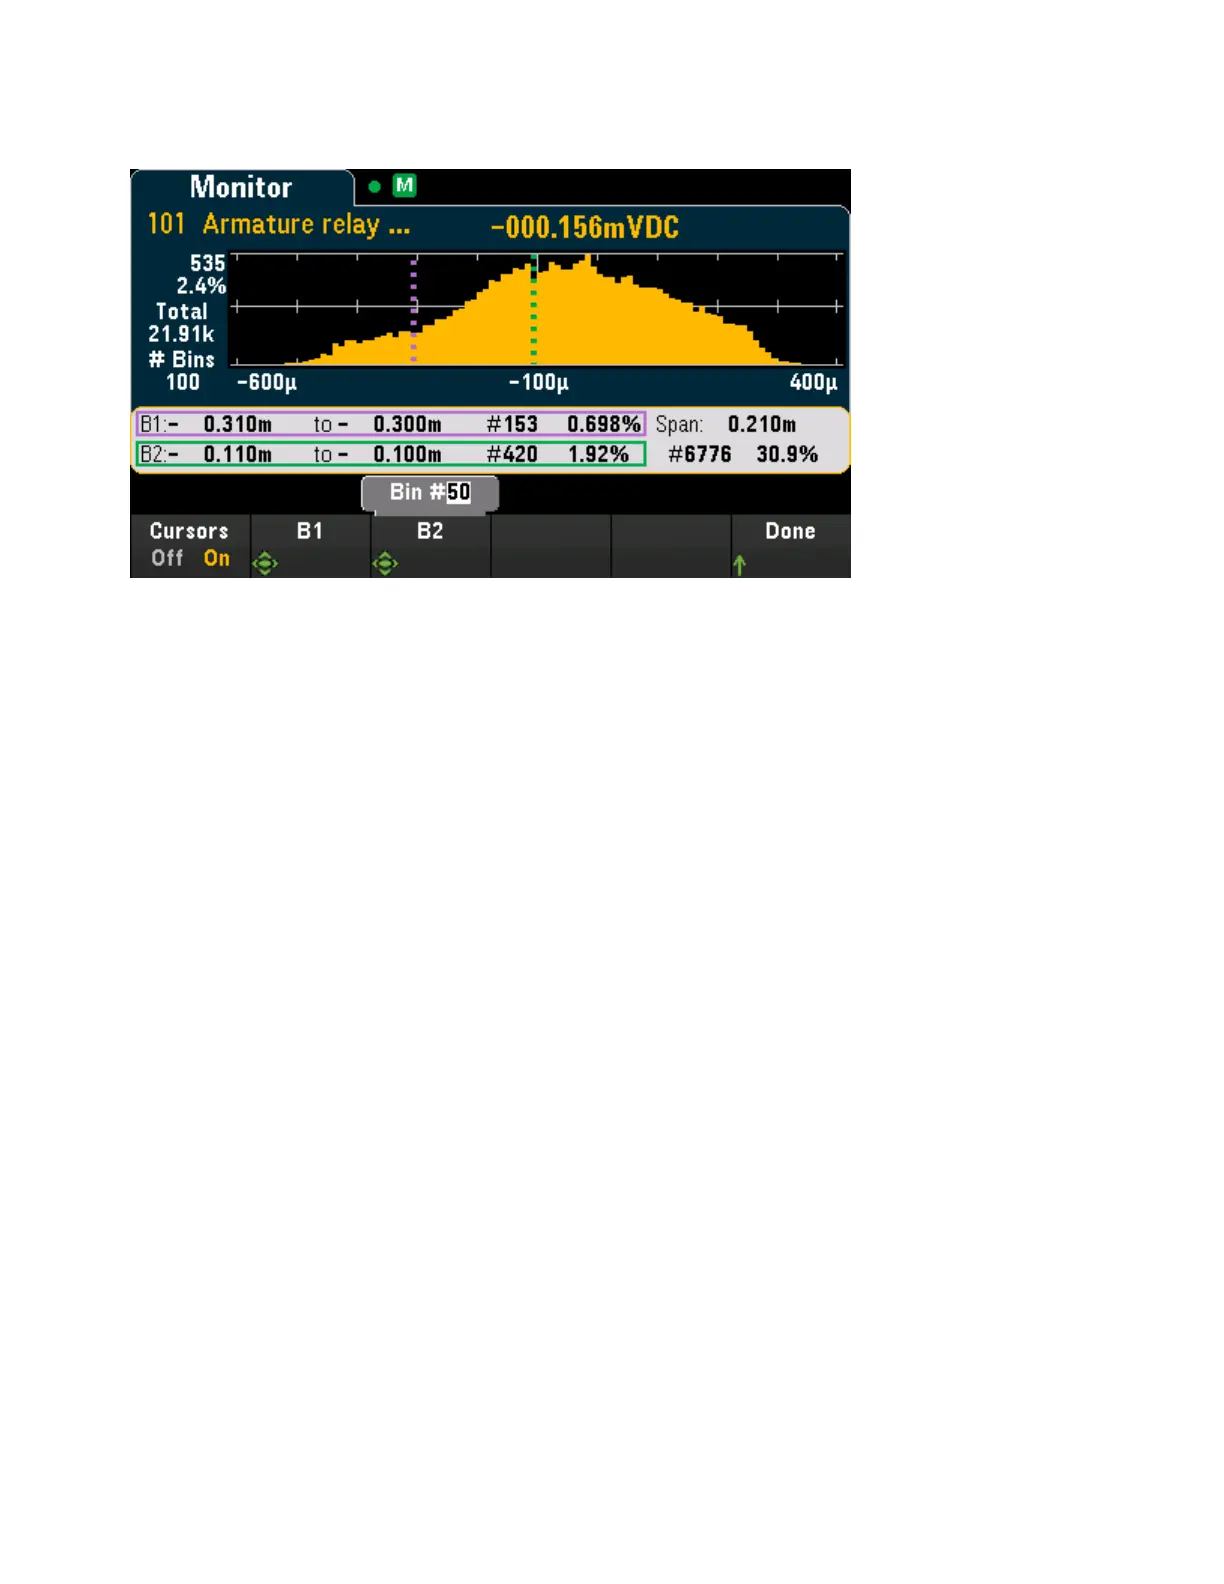
ation for cursor B1 is shown in the violet box, the bin information for B2 in the green box. For example, the
information in the B1 box is in the graphic below is:
l
0.310m to 0.300m - Range of DCV measurement values for this bin.
l
#153 - Number of samples in this bin.
l
0.698% - Percentage of the total number of samples in this bin.
The data between the B1 and B2 cursors, including the data in the B1 and B2 bins, is shown to the right of
the violet and green boxes. In the graphic above:
l
Span: 0.210m - The measurement range covered from B1 to B2.
l
#6776 - The number of samples from B1 to B2.
l
30.9% - The percentage of the total number of samples from B1 to B2.
3 Features and Functions
74 Keysight DAQ970A User's Guide