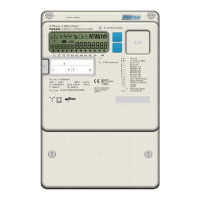
MCS301 - 3ph meter Page 50 of 142
MCS301 meter - product Manual 1.25 MetCom Solutions GmbH
11.3 End of billing profile register (historical data)
The characteristic of the end of billing data (historical data) measurement is:
• After a demand reset all historical data will be stored as a profile
• Up to 15 set of historical data can be created
• The maximum demand data are stored including time&date information
• Up to 40 different configurable values can be stored as historical data
• Below data can be selected as historical data:
Energy register total Tariff 1 … Tariff 8
1 active energy, +A 1-0:1.8.0.255 1-0:1.8.1.255 1-0:1.8.8.255
2 active energy, -A 1-0:2.8.0.255 1-0:2.8.1.255 1-0:2.8.8.255
3 reactive energy, +R 1-0:3.8.0.255 1-0:3.8.1.255 1-0:3.8.8.255
4 reactive energy, -R 1-0:4.8.0.255 1-0:4.8.1.255 1-0:4.8.8.255
5 reactive energy, R1 1-0:5.8.0.255 1-0:5.8.1.255 1-0:5.8.8.255
6 reactive energy, R2 1-0:6.8.0.255 1-0:6.8.1.255 1-0:6.8.8.255
7 reactive energy, R3 1-0:7.8.0.255 1-0:7.8.1.255 1-0:7.8.8.255
8 reactive energy, R4 1-0:8.8.0.255 1-0:8.8.1.255 1-0:8.8.8.255
9 apparent energy, +S 1-0:9.8.0.255 1-0:9.8.1.255 1-0:9.8.8.255
10 apparent energy, -S 1-0:10.8.0.255 1-0:10.8.1.255 1-0:10.8.8.255
11 active energy, /+A/ + /-A/ 1-0:15.8.0.255 1-0:15.8.1.255 1-0:15.8.8.255
12 active energy, /+A/ - /-A/ 1-0:16.8.0.255 1-0:16.8.1.255 1-0:16.8.8.255
13 iron losses, +U*U*h 1-0:83.8.4.255
14 copper losses, +I*I*h 1-0:83.8.1.255
15 iron losses, -U*U*h 1-0:83.8.5.255
16 Copper losses, -I*I*h 1-0:83.8.2.255
Table 13: list of end of billing data – energy register
Demand register total Tariff 1 … Tariff 4
1-0:1.6.4.255
2 Active demand, -P 1-0:2.6.0.255 1-0:2.6.1.255
1-0:2.6.4.255
1-0:3.6.4.255
4 Reactive demand, -Q 1-0:4.6.0.255 1-0:4.6.1.255
1-0:4.6.4.255
5 apparent demand, +S 1-0:9.6.0.255 1-0:4.9.1.255
1-0:4.9.4.255
6 apparent demand, -S 1-0:10.6.0.255 1-0:4.10.1.255
1-0:4.10.4.255
1-0:15.6.4.255
Table 14: list of end of billing data – demand register
M-Bus values total
1 Instance, channel 1 0-1:24.2.1.255
2 Instance, channel 2 0-2:24.2.1.255
3 Instance, channel 3 0-3:24.2.1.255
Table 15: list of end of billing data – M-Bus register