S350 Series 24-Port (PoE+) and 48-Port Gigabit Ethernet Smart Managed Pro Switches
Monitor the System User Manual297
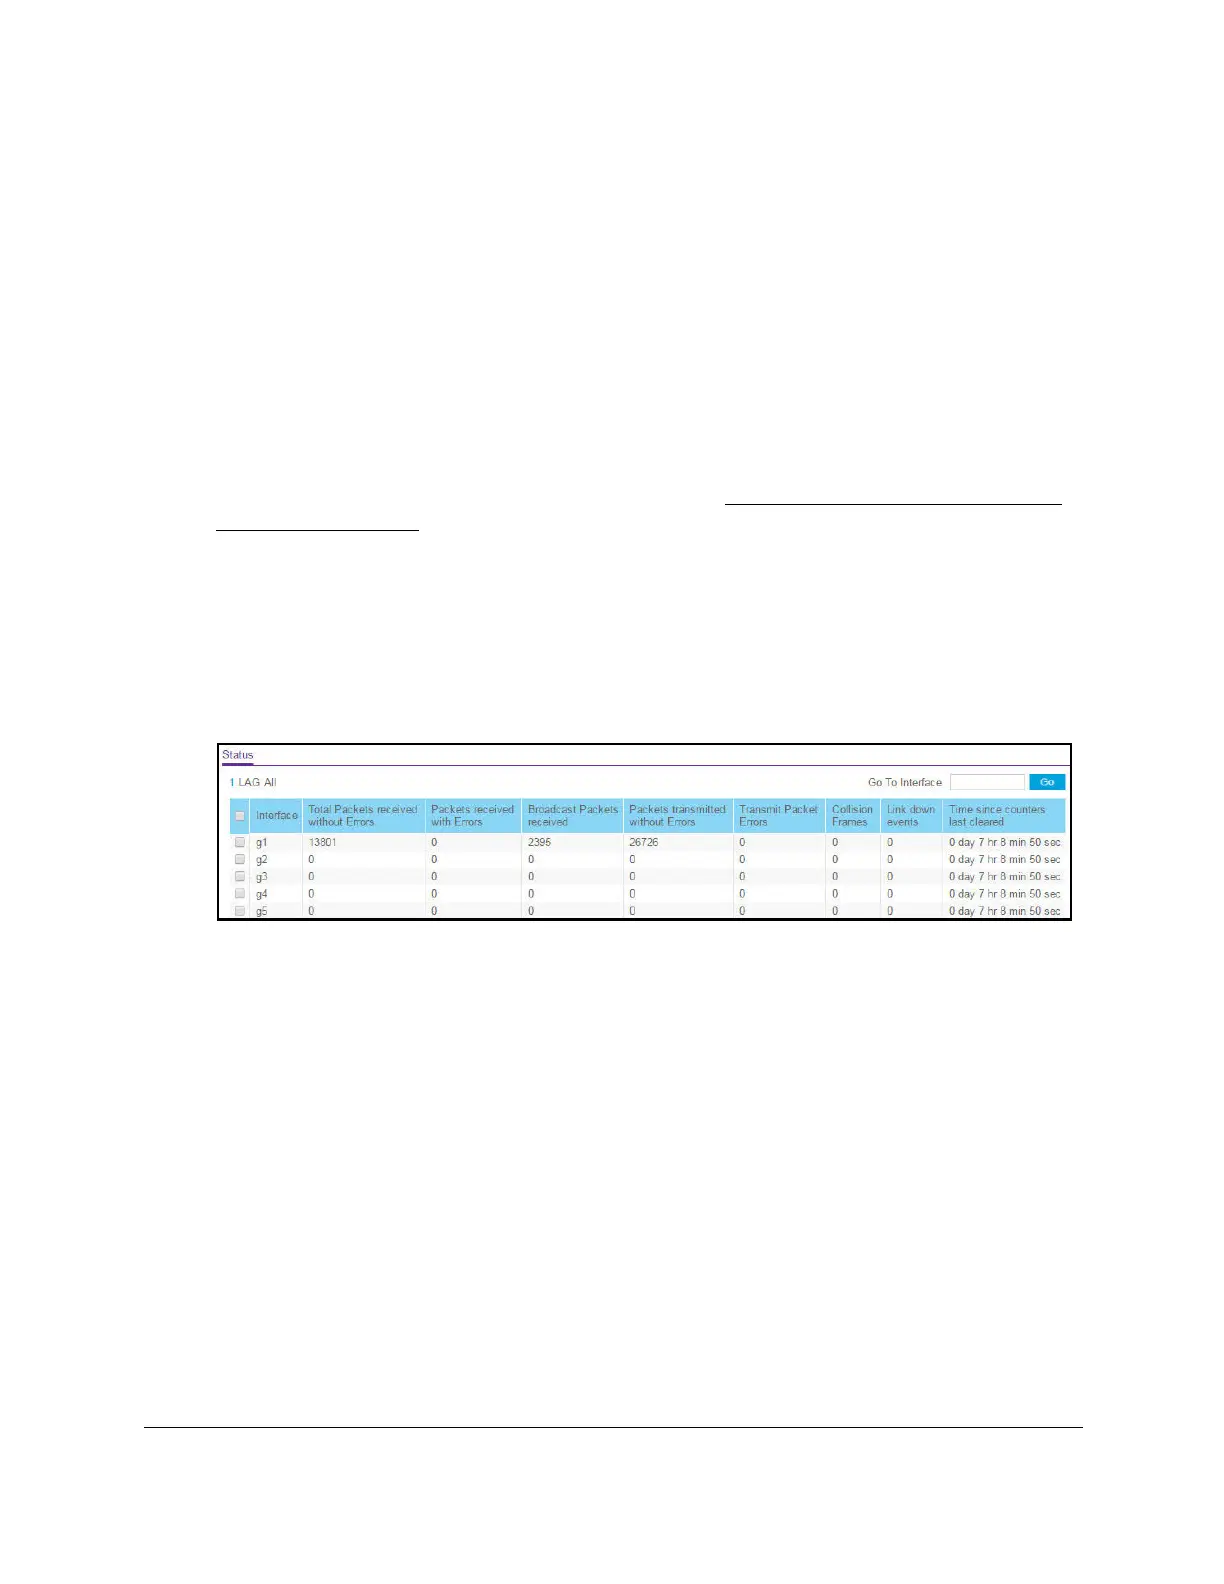
View Port Statistics
You can view a summary of per-port traffic statistics on the switch.
To view port statistics:
1. Connect your computer to the same network as the switch.
You can use a WiFi or wired connection to connect your computer to the network, or
connect directly to a switch that is off-network using an Ethernet cable.
2. Launch a web browser.
3. In the address field of your web browser, enter the IP address of the switch.
If you do not know the IP address of the switch, see
Discover or Change the Switch IP
Address on page 12.
The login window opens.
4. Enter the switch’s password in the Password field.
The default password is
password.
The System Information page displays.
5. Select Monitoring > Ports > Port Statistics.
6. Select whether to display physical interfaces, link aggregation groups (LAGs), or both by
clicking one of the following links above the table heading:
•1 (or the unit ID of the switch). Only physical interfaces are displayed.
This is the
default setting.
• LAG
. Only link aggregation groups are displayed.
• All. Both physical interfaces and link aggregation groups are displayed.
7. Select one or more interfaces by taking one of the following actions:
• T
o view a single interface, select the check box associated with the port, or type the
port number in the Go To Interface
field and click the Go button.
• To view multiple interfaces, select the check box associated with each interface.
 Loading...