S350 Series 24-Port (PoE+) and 48-Port Gigabit Ethernet Smart Managed Pro Switches
Monitor the System User Manual298
The following table describes the per-port statistics displayed on the page.
Table 66. Port statistics
Field Description
Interface The interface or LAG.
Total Packets Received
Without Errors
The total number of packets received that were without errors.
Packets Received With Error The number of inbound packets that contained errors preventing them from
being deliverable to a higher-layer protocol.
Broadcast Packets Received The total number of good packets received that were directed to the
broadcast address.
This does not include multicast packets.
Packets Transmitted
Without
Errors
The number of frames without errors that were transmitted by the port.
Transmit Packet Errors The number of outbound packets that could not be transmitted because of
errors.
Collision Frames The best estimate of the total number of collisions on this Ethernet segment.
Link Down Events The total number of link down events on a physical port.
Time Since Counters Last
Cleared
The elapsed time in days, hours, minutes, and seconds since the statistics
for the port were last cleared.
Reset Counters for All Interfaces on the Switch
To reset the counters for all interfaces on the switch:
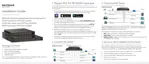
1. Connect your computer to the same network as the switch.
You can use a WiFi or wired connection to connect your computer to the network, or
connect directly to a switch that is off-network using an Ethernet cable.
2. Launch a web browser.
3. In the address field of your web browser, enter the IP address of the switch.
If you do not know the IP address of the switch, see
Discover or Change the Switch IP
Address on page 12.
The login window opens.
4. Enter the switch’s password in the Password field.
The default password is
password.
The System Information page displays.
5. Select Monitoring > Ports > Port Statistics.
The Port Statistics page displays.
6. Select the check box in the heading of the table.
 Loading...