radEAGLE User Manual radEAGLE Measuring Modes
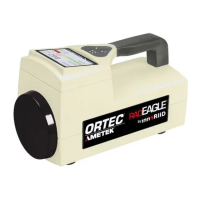
Previous Values Moving Left
Current Count Rate
Current Value
Oldest Value
Background Orientation Line
Figure 27: Detect mode chart
Blue Bars
represent neutron incidents, if any.
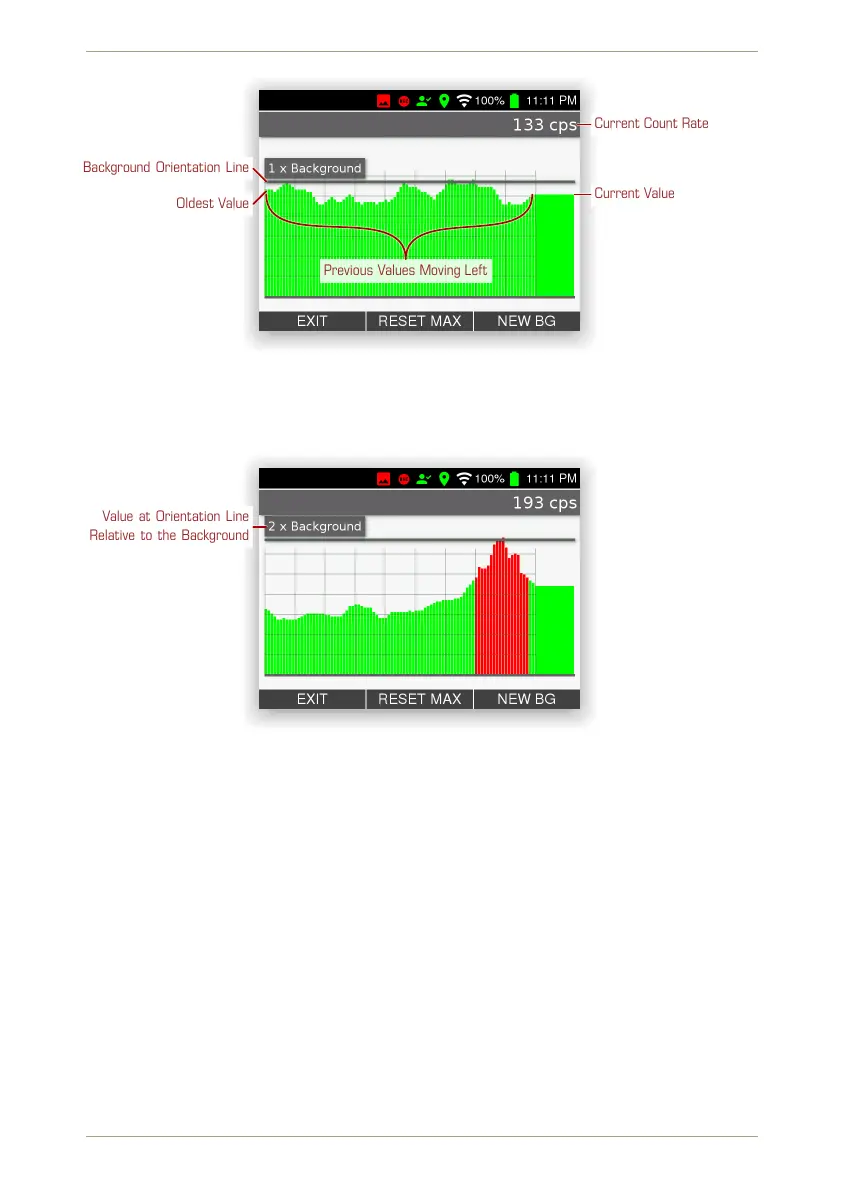
Value at Orientation Line
Relative to the Background
Figure 28: Detect mode: Approaching a source
If the radiation level increases, the chart will be rescaled to multiples of the background
determined at the beginning (Fig. 29, p. 36).
© innoRIID GmbH • 2019-04-11 Software 3.2.12 • Document 3.3.0o 35/147