7.4 Spectrum Browser radEAGLE User Manual
Ü To return to the complete spectrum…
1. Double-Click in the chart area.
7.4.1.2 Manual Peak Analysis
Ü To analyze a peak…
1. Click .
2. Click and hold at one end of the peak.
This also works in the zoomed diagram (see 7.4.1.1, p. 90).
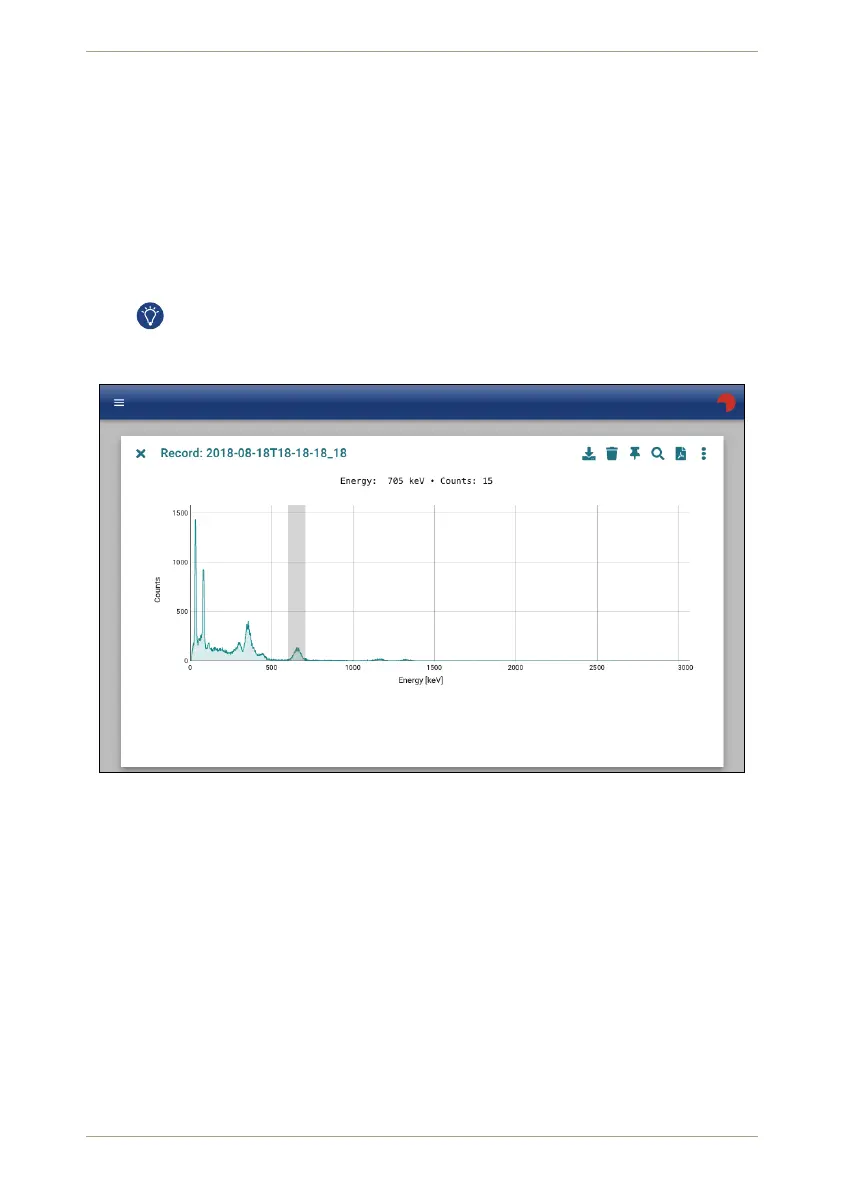
3. Drag to the other end of the peak. The region will be accented (Fig. 107, p. 92).
RADEAGLE
18181
Figure 107: Marking a peak for analysis
4. Release the mouse button. The peak is colored in the diagram and the analysis results
are shown below it (Fig. 108, p. 93).
7.4.1.3 Automatic Peak Analysis
Ü To trigger an automatic peak analysis…
1. Click .
The spectrum will be scanned and all recognized peaks are accented in color. Details
for the peaks will be shown below the diagramm (Fig. 109, p. 94).
92/147 Software 3.2.12 • Document 3.3.0o © innoRIID GmbH • 2019-04-11