7.4 Spectrum Browser radEAGLE User Manual
You can access the features with buttons along the top:
Download the spectrum.
Delete the spectrum.
Manual peak analysis, see 7.4.1.2, p. 92.
Automatic peak analysis, see 7.4.1.3, p. 92.
PDF report, see 7.4.1.5, p. 97.
Spectrum details, see 7.4.1.4, p. 95.
7.4.1.1 Spectrum Diagram
RADEAGLE
18181
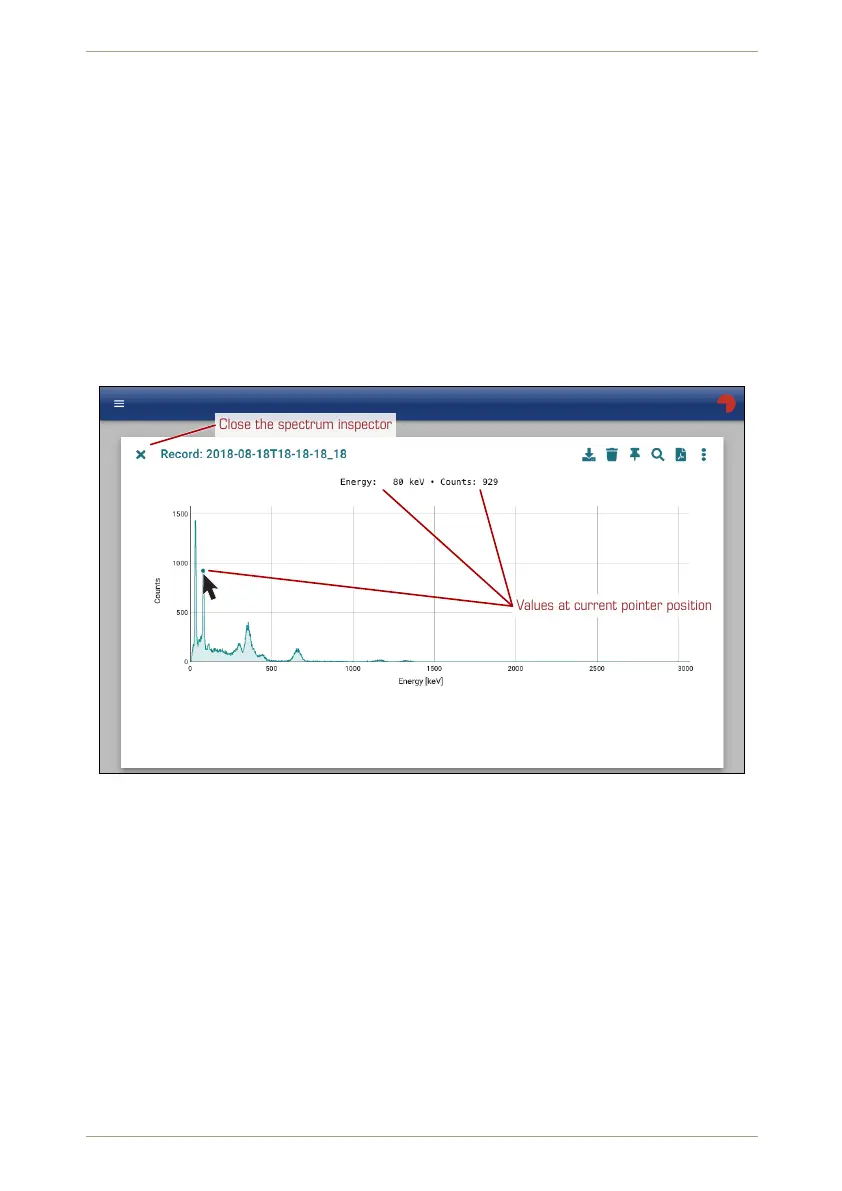
Close the spectrum inspector
Values at current pointer position
Figure 104: Spectrum diagramm in the Web interface
Ü To see coordinates of a specific position…
1. Move the pointer within the chart area and watch the coordinates of the current
position shown above the chart (Fig. 104, p. 90).
Ü To zoom into a region of interest…
1. Click and hold at one end of the ROI.
2. Drag to the other end of the ROI. The region will be accented (Fig. 105, p. 91).
90/147 Software 3.2.12 • Document 3.3.0o © innoRIID GmbH • 2019-04-11