Operation
900-0117-01-00 Rev B 51
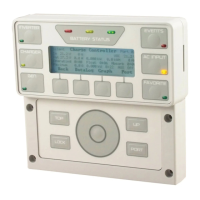
Figure 45 Battery Voltage Graph (with FLEXnet DC)
The
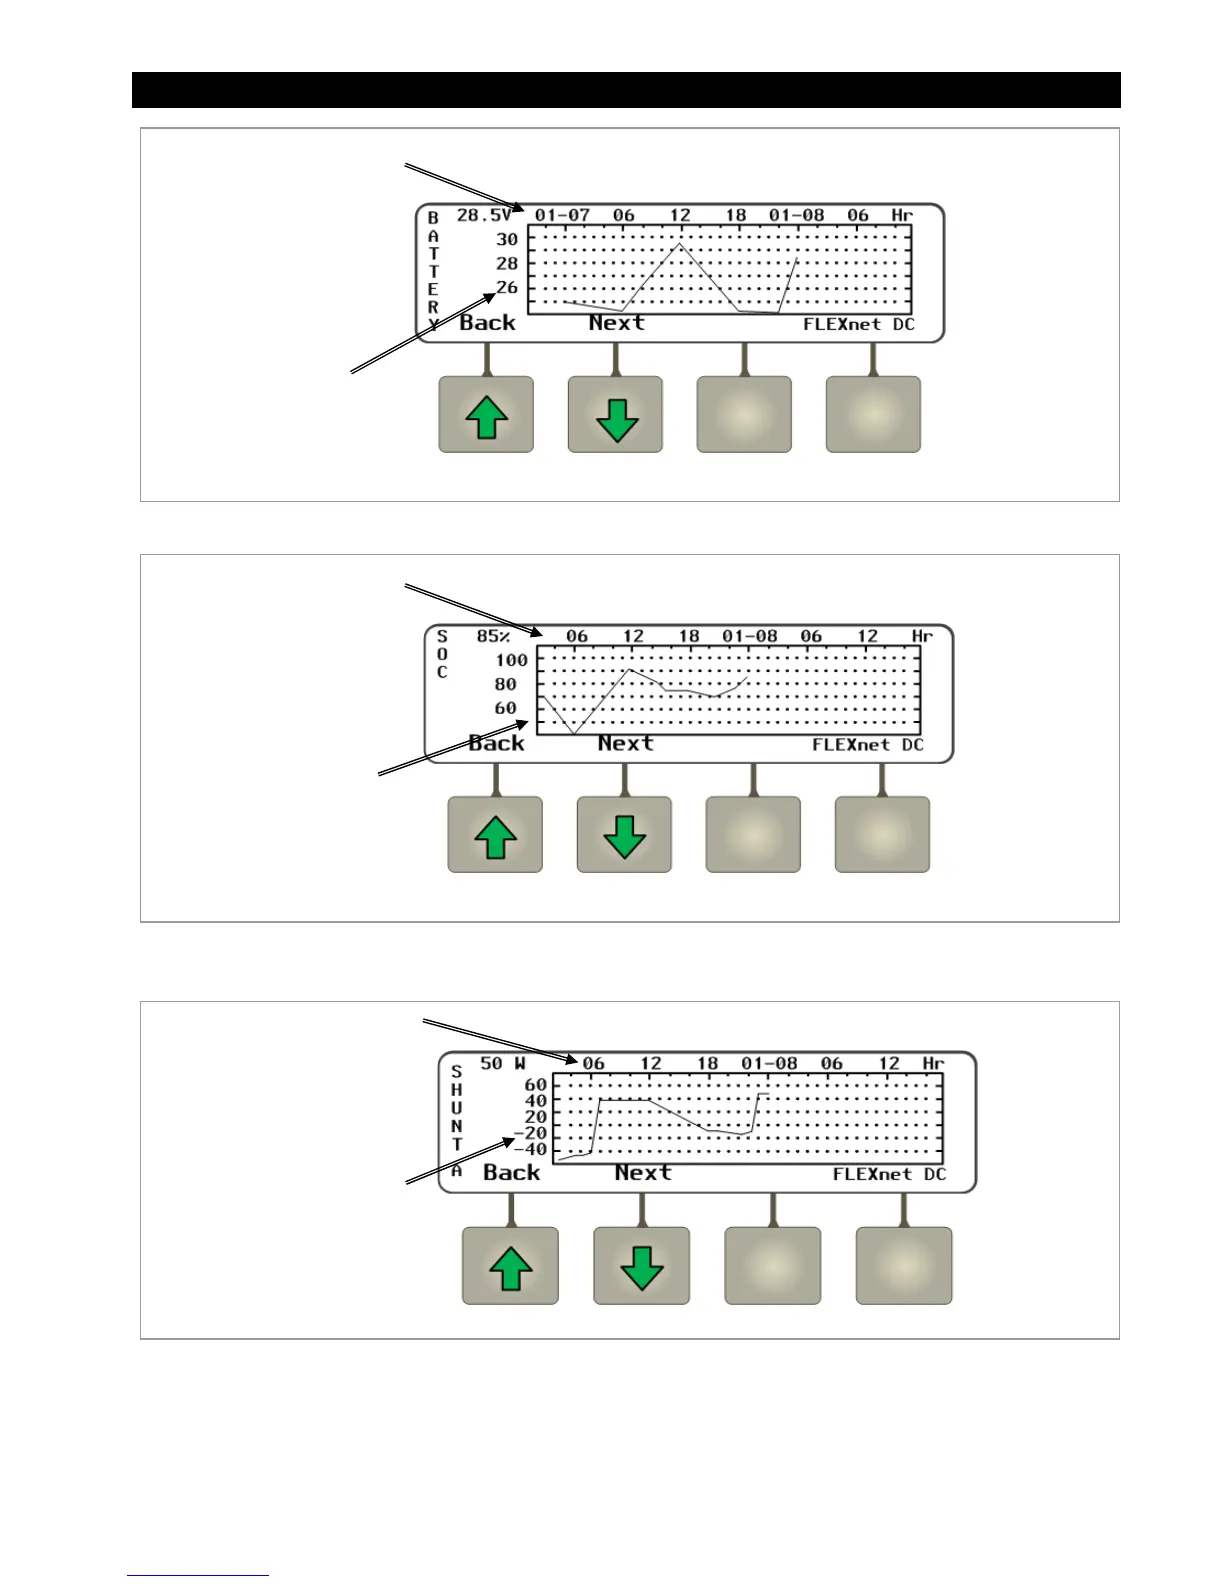
<Next>
soft key brings up a screen which shows changes in SOC over time.
Figure 46 State-of-Charge (SOC) Graph (with FLEXnet DC)
The
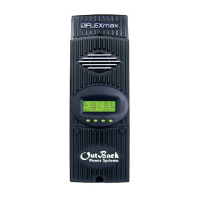
<Next>
soft key brings up a screen which shows changes in wattage over time for the first shunt,
Shunt A.
Figure 47 Shunt A Graph (with FLEXnet DC)
Continuing to press the <Next> soft key will proceed to Shunts B and C if they have been enabled. If
Shunts B or C are not enabled, the <Next> soft key will return to the Battery graph.
This axis shows
battery voltage.
This axis shows date
and time in 6-hour
increments.
This axis
shows SOC.
This axis shows date
and time in 6-hour
increments.
This axis shows the wattage
readings calculated from
shunt A.
This axis shows date
and time in 6-hour
increments.