5. Quality control ABL800 FLEX Operator's Manual
Quality control result, Continued
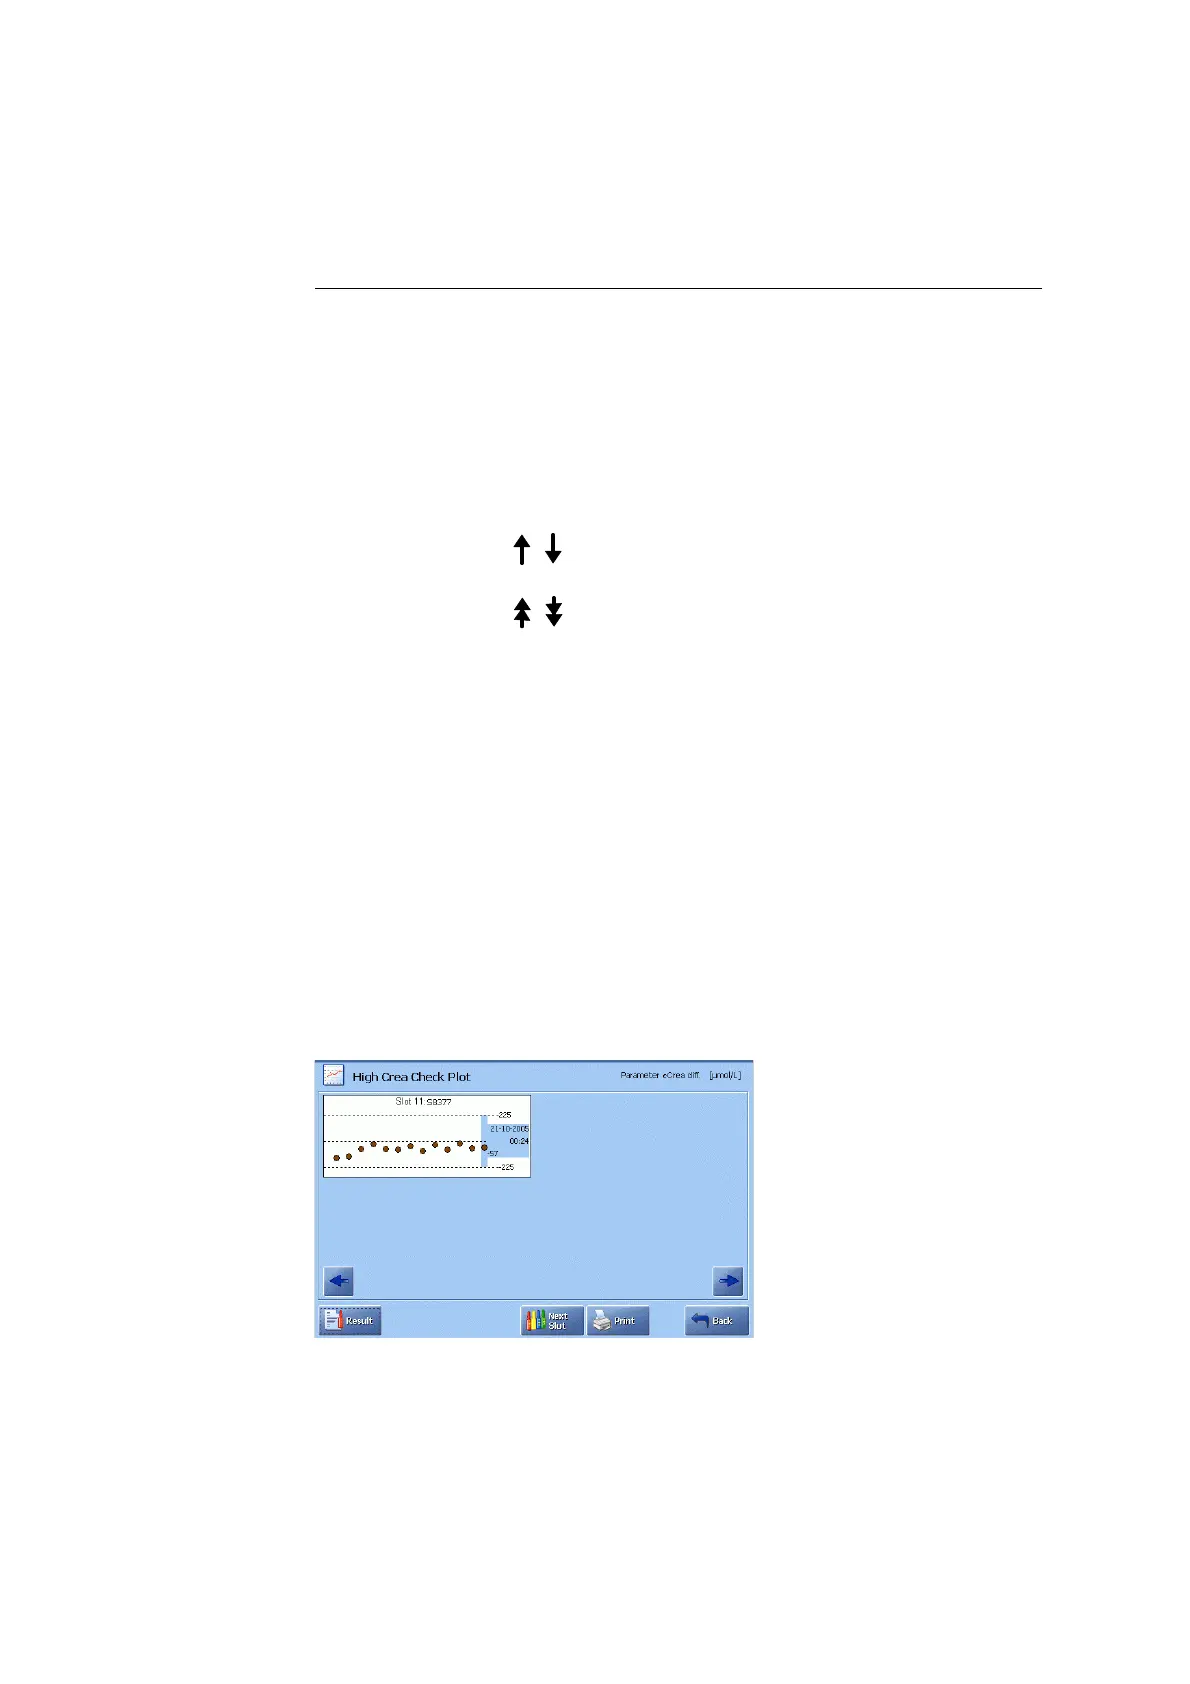
Quality control
plot (continued)
Plot element Function
Shaded block Date, time and measured value for the highlighted
measurement. Use the arrow buttons to scroll the plot and
view other measurements.
Control range
limits
Show the upper and the lower limits of the control range
for the highlighted measurement.
Dots Show the number of measurements for the selected
parameter. To view a measurement result, highlight a dot
on the screen and press Result.
Out-of-range
symbols
Measurement outside the control range and
inside the statistical range.
Measurement outside both the control and
statistical ranges.
Use the following buttons to do the following:
Next Param.
Prev. Param.
Display the quality control plots for the requested
parameter.
Next Slot
Display plots of the next control solution slot.
Result
View quality control result for the highlighted measurement of
the highlighted plot.
Print
Print out the plot.
Back
Return to the previous screen.
(For the ABL8x7 FLEX analyzers only):
The plot for the High Crea Check of the ABL8x7 FLEX analyzers presents Crea
diff
.
The screen is similar to the quality control solution plot, but the Next Param. and
Prev Param. buttons are absent.
5-14