Operation
CS210 Rev. B4 Feb 2015 67
An unrealistic temperature display of e.g. 0º C may be a sign of a communication error!
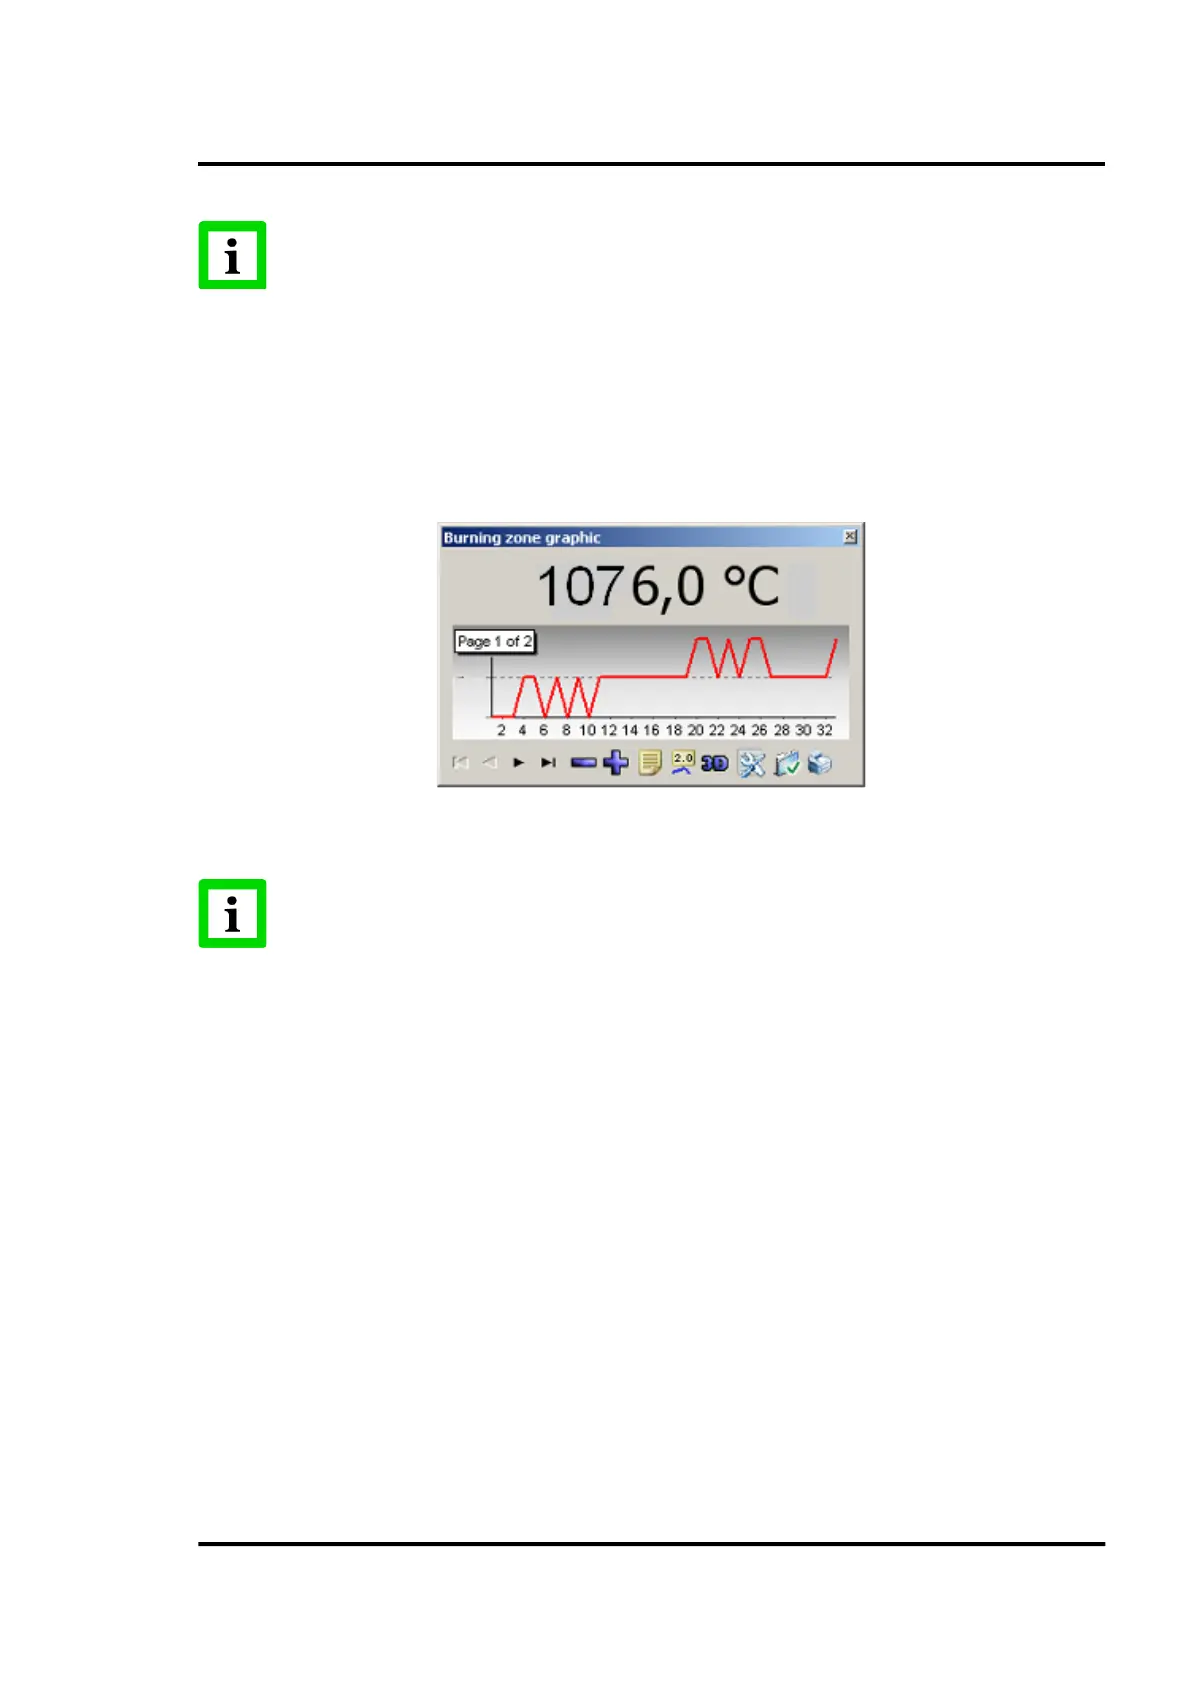
7.2.6 <Secondary> <Burning zone graphic>
This screen shows the temperature measured by the burning zone sensor. The data is recorded at the
point of completion of the lap currently being displayed. It will be refreshed after each kiln lap.
Apart from the numerical display, there is a chart that allows the user to visualize the temperature
trend over time.
Figure 66: Burning zone chart
An unrealistic temperature display of e.g. 0º C may often be a sign of a communication
error with the pyrometer or an indication of an improperly configured pyrometer. Make
sure that the pyrometer is correctly identified as a burning zone pyrometer!
7.2.7 <Secondary> <LRM view>
The LRM detail screen graphically represents the LRM information associated with the current lap.
This information comprises of the time to complete the current lap, the time for each ring to complete
that lap, and the rotational deviation or offset of each tire relative to the driven tire.
The screen has several tabs explained below.
7.2.7.1 <Kiln view> Tab
This screen shows a graphical representation of the kiln with the lap time for each ring to complete the
current lap, and the offset (slip) relative to the driven tire.