Operation
74 Rev. B4 Feb 2015 CS210
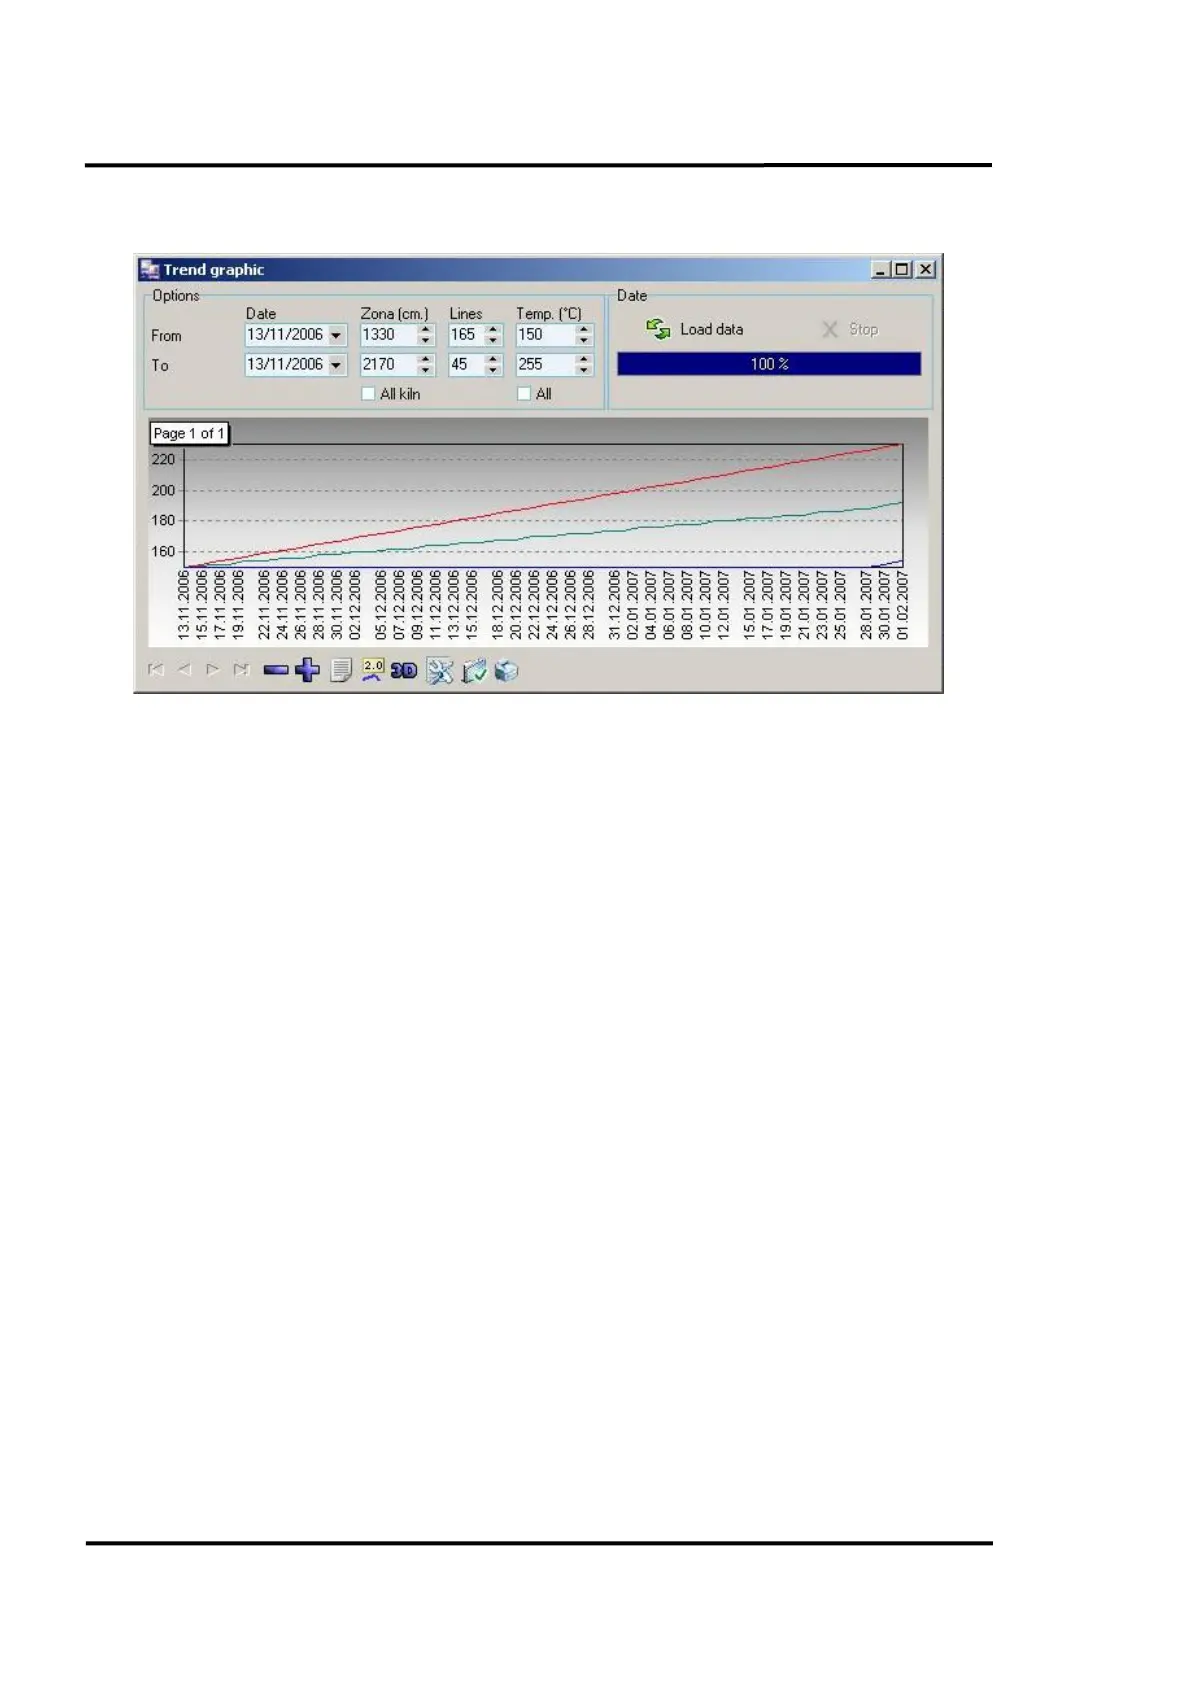
7.2.12 <Graphic> <Trend>
Figure 77: <Graphic trend> screen
This chart displays the same data as the histogram but in a line chart format. The lines are colour
coded showing maximum temperature (red), average temperature (green) and minimum temperature
(blue). As before the area of interest, time period of interest and temperature are all user defined.