Operation
CS210 Rev. B4 Feb 2015 69
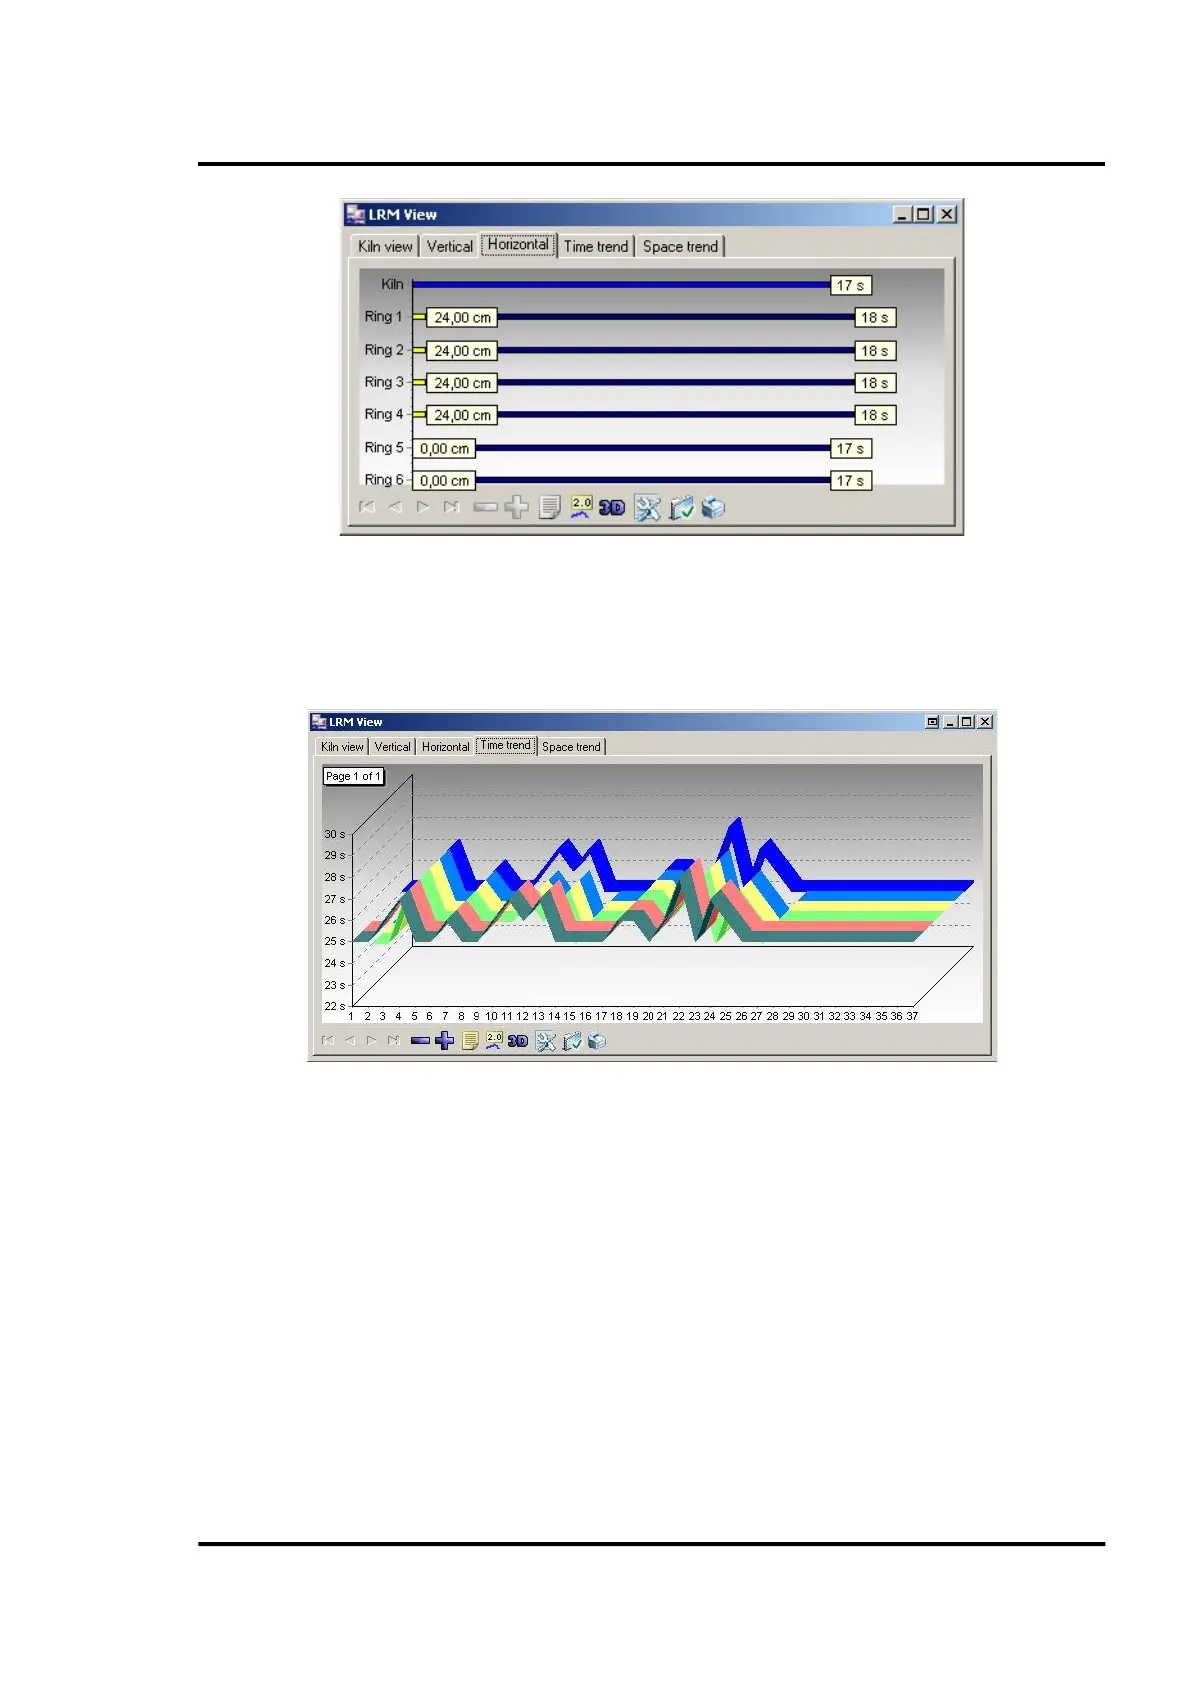
Figure 69: <Horizontal> Tab of LRM view (info about the slip)
7.2.7.4 <Time trend> Tab
This tab displays a line chart of the lap duration for each tire over a number of rotations. This allows
the user to visualize the evolution of the timing and easily compare the data for each tire.
Figure 70: <Time trend> Tab of LRM view
7.2.7.5 <Space trend> Tab
This one tab displays the offset for each tire (slip) on a line chart allowing the operator to see the
evolution of such offsets and easily compare the data for each tire.