Operation
CS210 Rev. B4 Feb 2015 73
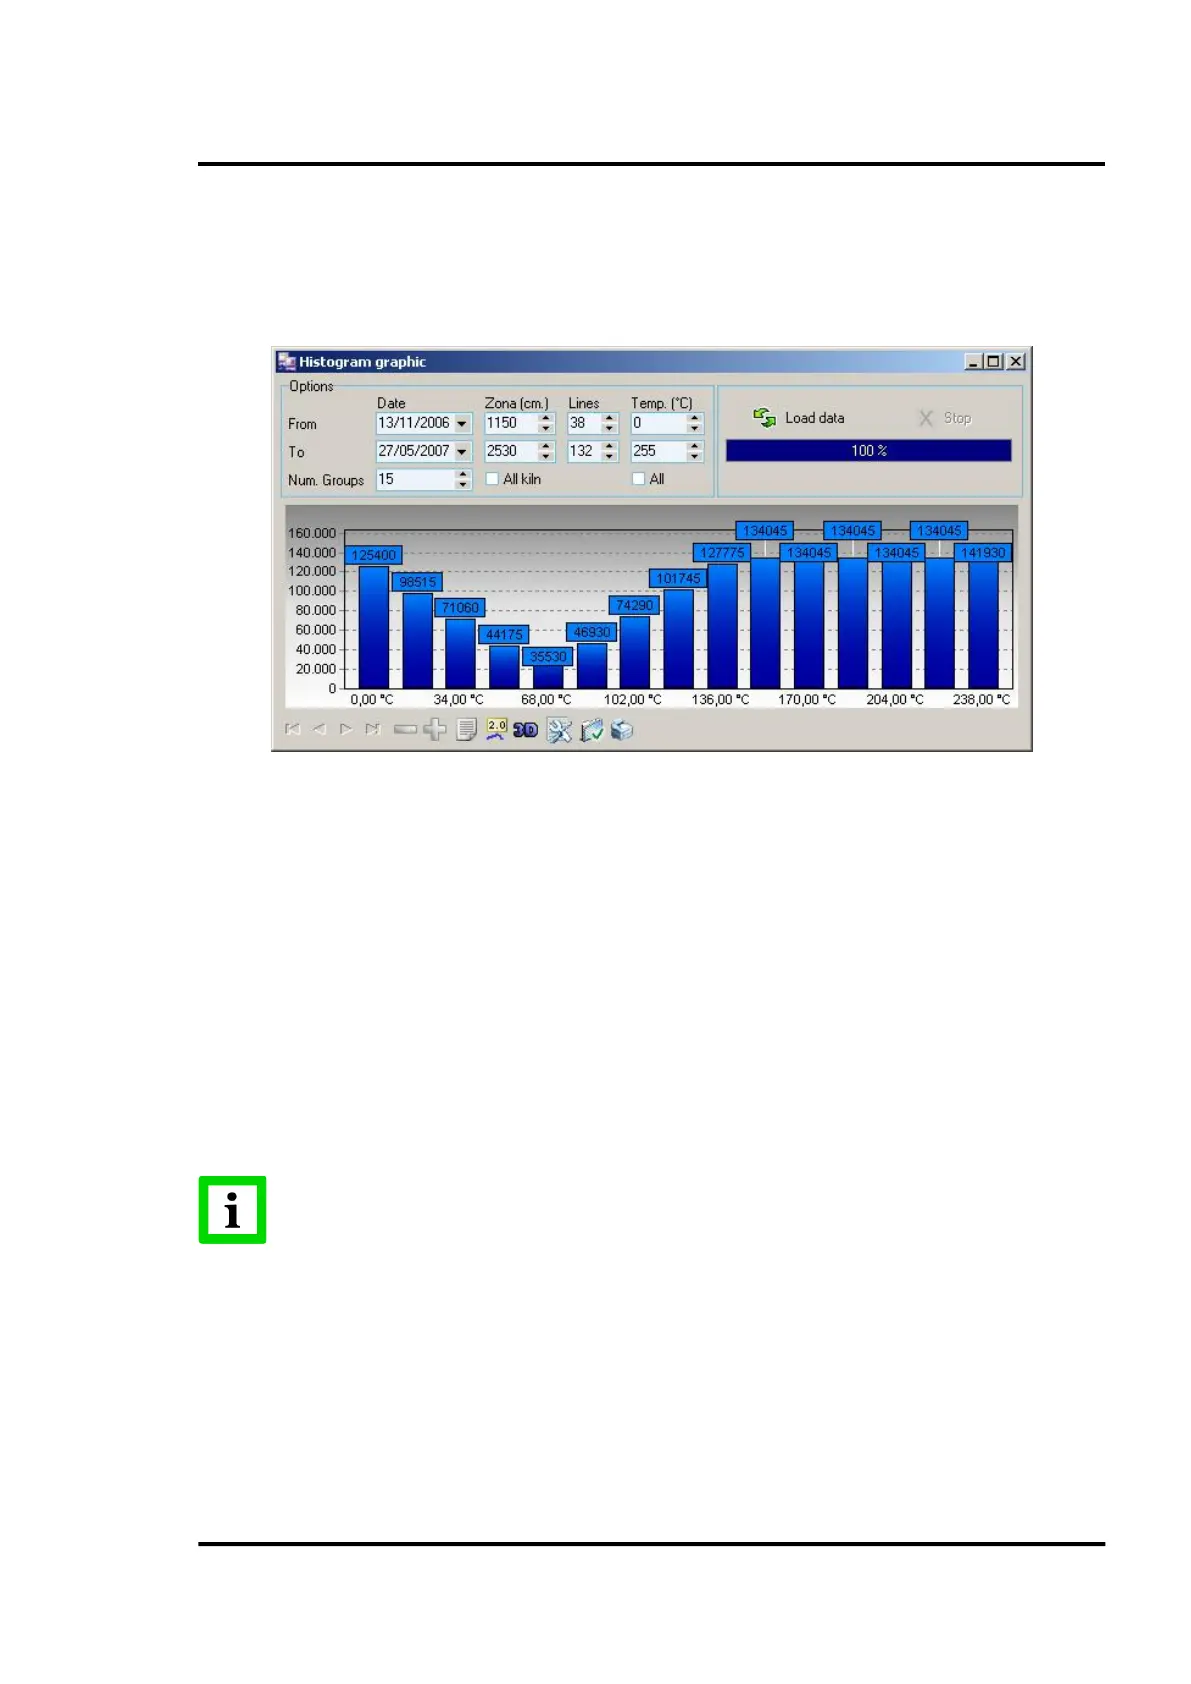
7.2.11 <Graphic> <Histogram>
Within the <Graphics> drop-down menu the operator can select the histogram view.
A histogram is a bar chart where the “x” axis represents the temperatures and the “y” axis represents
the corresponding pixel count.
Figure 76: Histogram chart
On this screen the user can define:
• the time period of interest, (from X date to Y date),
• the particular zone of interest along the length of the kiln (start point at X cm, end point at Y
cm)
• the particular lines of interest over the kiln rotation
• the temperature range to be reported
• number of groups to display the temperature data
Once the values are established, the <Load data> button starts the data loading process. Depending on
the values shown, the loading process may take long time, so a progress bar indicates the
approximated percentage of the process done. Activating the <Stop> button will stop the data-loading
process.
The area to be studied can be graphically selected in the ‘real time view’, as described
in section 7.2.1 <Main> <Real time>, page 61!