Settings
Addr. Parameter Setting Options Default Setting Comments
901 WAVEFORMTRIGGER Save w. Pickup
Save w. TRIP
Start w. TRIP
Save w. Pickup Waveform Capture
903 MAX. LENGTH 0.30 .. 5.00 sec 1.00 sec Max. length of a Waveform
Capture Record
904 PRE. TRIG. TIME 0.05 .. 0.50 sec 0.20 sec Captured Waveform Prior to
Trigger
905 POST REC. TIME 0.05 .. 0.50 sec 0.10 sec Captured Waveform after Event
906 BinIn CAPT.TIME 0.10 .. 5.00 sec; ∞ 0.50 sec Capture Time via Binary Input
Information List
No. Information Type of
Informa-
tion
Comments
- FltRecSta IntSP Fault Recording Start
4 >Trig.Wave.Cap. SP >Trigger Waveform Capture
30053 Fault rec. run. OUT Fault recording is running
Commissioning Aids
For commissioning of the device, a comprehensive commissioning and monitoring tool is available.
Web-Monitor
The device is provided with a comprehensive commissioning and monitoring tool that monitors and checks
the measured values and the whole differential protection system. Using a personal computer in conjunction
with a web browser, this tool enables the user to clearly chart the state of the system and the differential
protection values, measured values and indications. The necessary operator software is integrated in the
device; online help can be found on the DIGSI CD and is also available in the Internet.
To ensure a proper communication between the device and the PC browser the transmission speed must be
equal for both. Furthermore, an IP-address is necessary so that the browser can identify the device. For 7UT6x,
the following is valid:
Transmission speed:
115 kBaud;
IP-address
for connection at the front operator interface: 192.168.1.1,
for connection to the rear service interface (port C): 192.168.2.1.
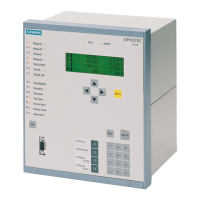
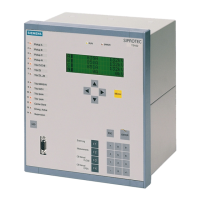
The “Web-Monitor”shows the device front with its keypad and LCD display on the screen, thus allowing to
operate the device from the PC. The actual operation of the device can be simulated with the mouse pointer.
Measured values and the values derived from them are graphically displayed as phasor diagrams. You can also
view tripping diagrams, scalar values are shown in numerical form. Most of the measured values, discussed in
Section 2.22.2 Measurement, can also be displayed in the “Web-Monitor”.
For more details on working with the “Web-Monitor”, refer to the Online Help attached.
Functional Description
This tool allows to graphically illustrates on a PC, for example, the currents and their phase angles for both
sides of the protected object during commissioning and during operation. In addition to phasor diagrams of
measured values, numerical values are indicated. The following figure shows an example of this function.
Additionally the position of the differential and restraint values can be viewed in the tripping characteristic.
2.22.8.3
2.22.8.4
2.22.9
2.22.9.1
Functions
2.22 Auxiliary Functions
SIPROTEC 4, 7UT6x, Manual 299
C53000-G1176-C230-5, Edition 09.2016
 Loading...
