The following must be observed:
•
The value pairs should be entered in increasing sequence. If desired, fewer than 20 pairs can be entered.
In most cases, about 10 pairs is sufficient to define the characteristic accurately. A value pair which is not
used has to be made invalid by entering "∞” for the threshold! The user must ensure that the value pairs
produce a clear and constant characteristic .
The current values entered should be those from the following table, along with the matching times.
Deviating values MofPU (multiples of PU-values) are rounded. This, however, will not be indicated.
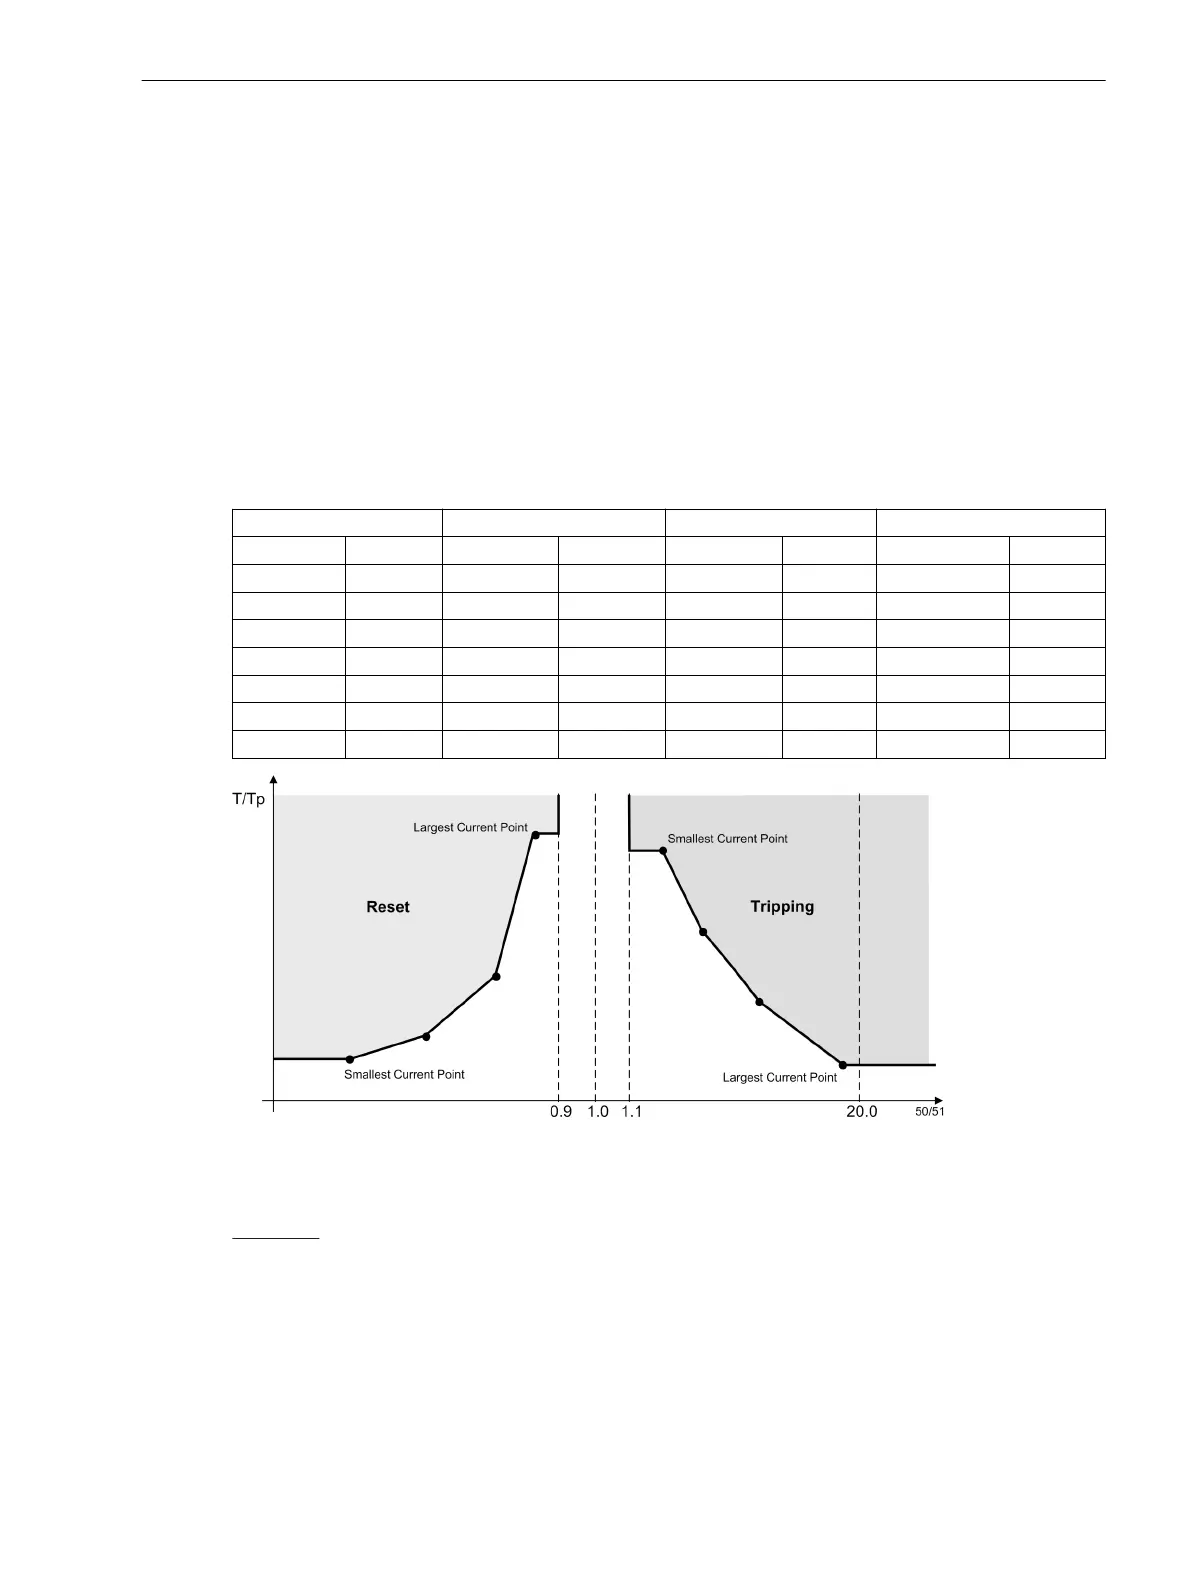
Currents smaller than the current value of the smallest curve point will not lead to an extension of the
tripping time. The pickup curve (see Figure 2-18, right side) runs parallel to the current axis, up to the
smallest current value point.
Currents larger than the largest current value entered will not lead to a reduction of the tripping time.
The pickup curve (see Figure 2-18, right side) runs parallel to the current axis, beginning with the
greatest current value point.
Table 2-4 Preferential values of standardized currents for user-defined tripping curves
MofPU = 1 to 1.94 MofPU = 2 to 4.75 MofPU = 5 to 7.75 MofPU = 8 to 20
1.00 1.50 2.00 3.50 5.00 6.50 8.00 15.00
1.06 1.56 2.25 3.75 5.25 6.75 9.00 16.00
1.13 1.63 2.50 4.00 5.50 7.00 10.00 17.00
1.19 1.69 2.75 4.25 5.75 7.25 11.00 18.00
1.25 1.75 3.00 4.50 6.00 7.50 12.00 19.00
1.31 1.81 3.25 4.75 6.25 7.75 13.00 20.00
1.38 1.88 14.00
1.44 1.94
[anwenderkennl-260602-kn, 1, en_US]
Figure 2-18 Using a user-defined curve
The value pairs are entered at address 1231 MofPU Res T/Tp or 1331 MofPU Res T/TEp to recreate the
reset curve. The following must be observed:
•
The current values entered should be those from the following Table 2-5, along with the matching times.
Deviating values of MofPU are rounded. This, however, will not be indicated.
Currents larger than the largest current value entered will not lead to an extension of the dropout time.
The dropout curve (see Figure 2-18, left side) runs parallel to the current axis, up to the largest curve
value point.
Currents which are smaller than the smallest current value entered will not lead to a reduction of the
dropout time. The dropout curve (see Figure 2-18, left side) runs parallel to the current axis, beginning
with the smallest curve value point.
Functions
2.2 Overcurrent Protection 50, 51, 50N, 51N
SIPROTEC 4, 7SJ62/64, Manual 77
C53000-G1140-C207-8, Edition 08.2016
 Loading...