3. Start the measurement process with the
<Start/Stop> key. The display indicates
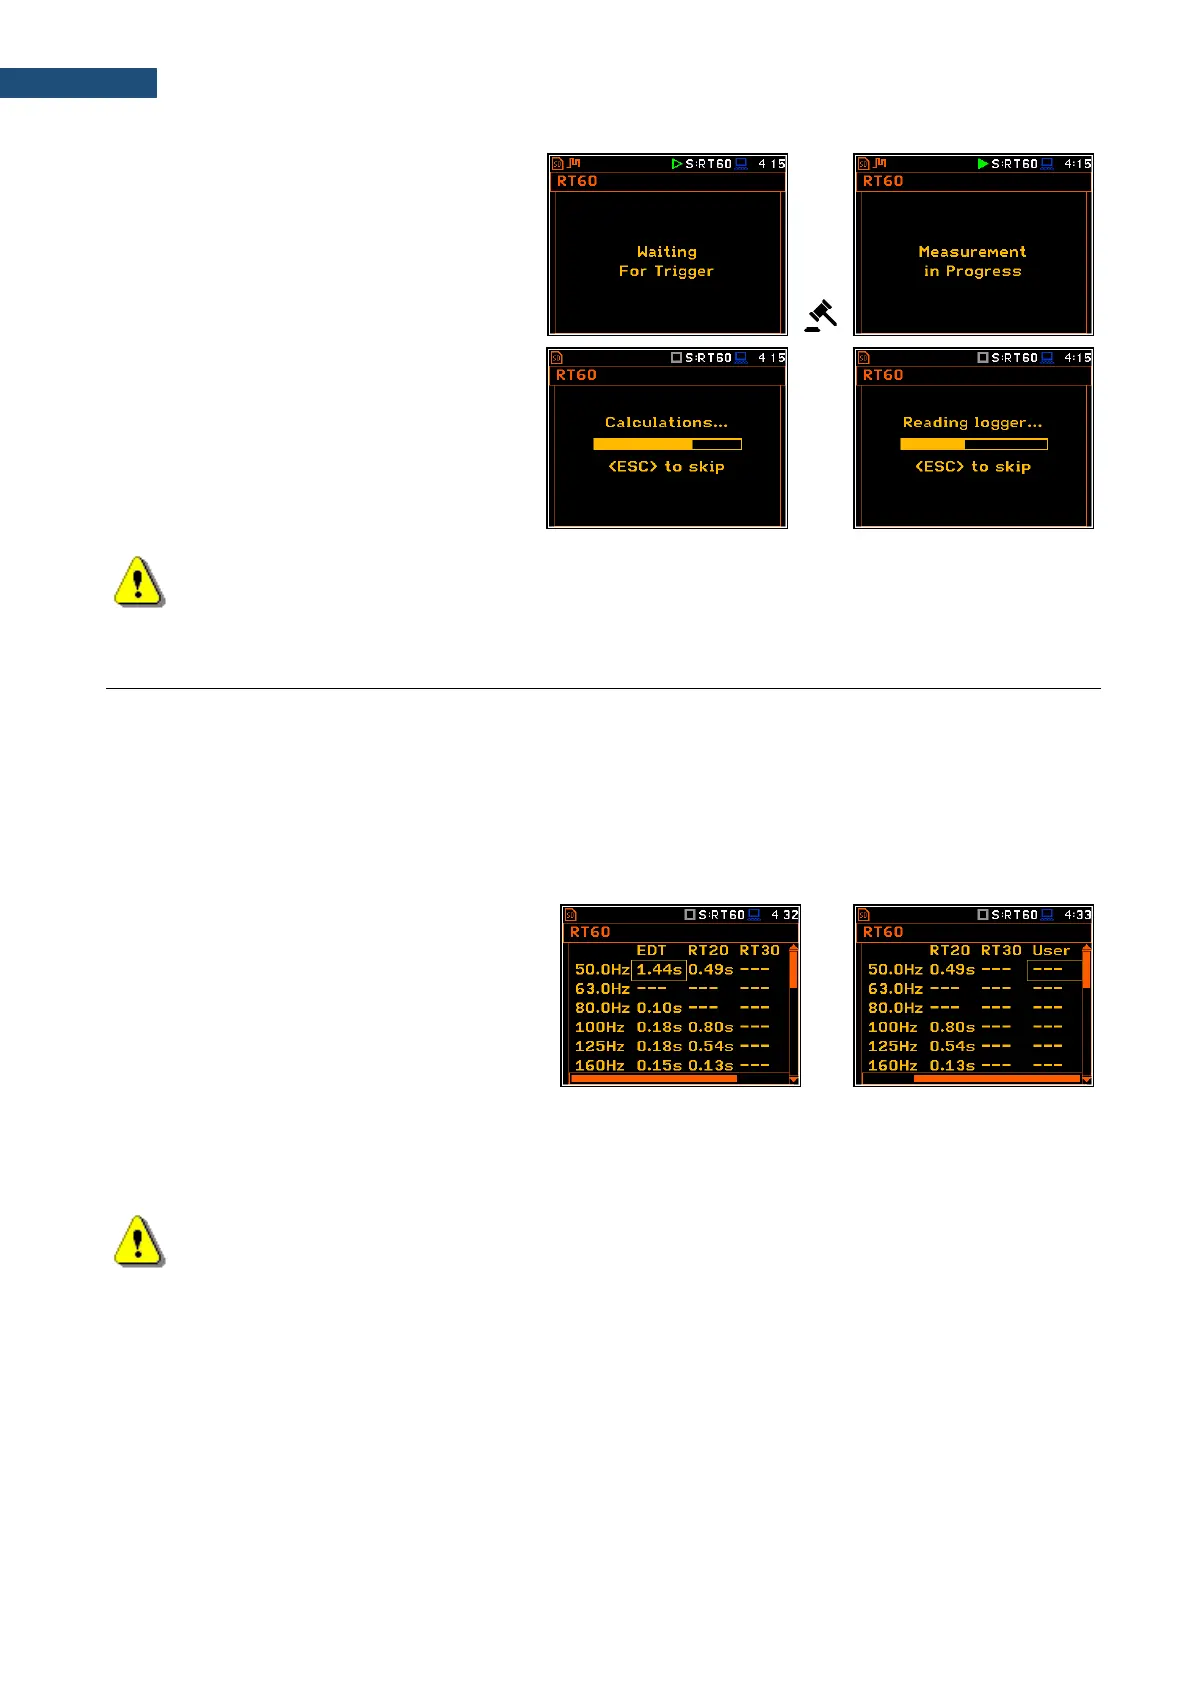
that the instrument is waiting for the
trigger condition fulfilment.
4. Fire the impulse sound power source. If
the trigger condition is fulfilled the
instrument starts to collect data.
5. After the data recording process ends,
the instrument starts the calculation of
the reverberation time results. During
this process, the messages
„Calculations…” and
“Reading Logger…” appear.
6. To save results press the <Save> key or
use the File menu option.
Note: During the data collections in the tested room all other sources of sound should be suppressed
to not affect the measurements.
12.5 VIEWING OF RT60 RESULTS
The RT60 measurement results for all 1/1 or 1/3-octave bands and three Total values can be viewed in three
different view modes:
1. Table of EDT, RT20, RT30 and User results;
2. Bar plot of EDT, RT20, RT30 and User results;
3. Plot of sound pressure level decay curves.
You may switch between the view modes with the <Alt> and ◄ / ► key pressed together.
Table of RT60 results
The table presents the results of reverberation
time for different RT60 results:
- EDT - early decay time;
- RT20 - reverberation time calculated with
20 dB dynamics;
- RT30 - reverberation time calculated with
30 dB dynamics;
- User - reverberation time, calculated with
the user defined dynamics.
Note: If “- - -” text appears in the RT indicator field, it means that for this band with the selected
parameters (Noise Mar.) the required measurement conditions were not fulfilled to obtain the results
(for more details see Appendix E).