You may change the cursor position with the
◄ / ► key.
The Spectrum position is accessible only in
the active 1/1 Octave, 1/3 Octave or FFT
functions.
The spectra views are described in Chapters
10 and 11.
The Statistics position is accessible only for Sound measurements.
Statistics is the cumulative probability density function of exceeding the noise
level during the measurement period. The X axis defines the probability of
exceeding the noise level, statistical level Lnn, and the axis Y defines the
calculated noise level in dB.
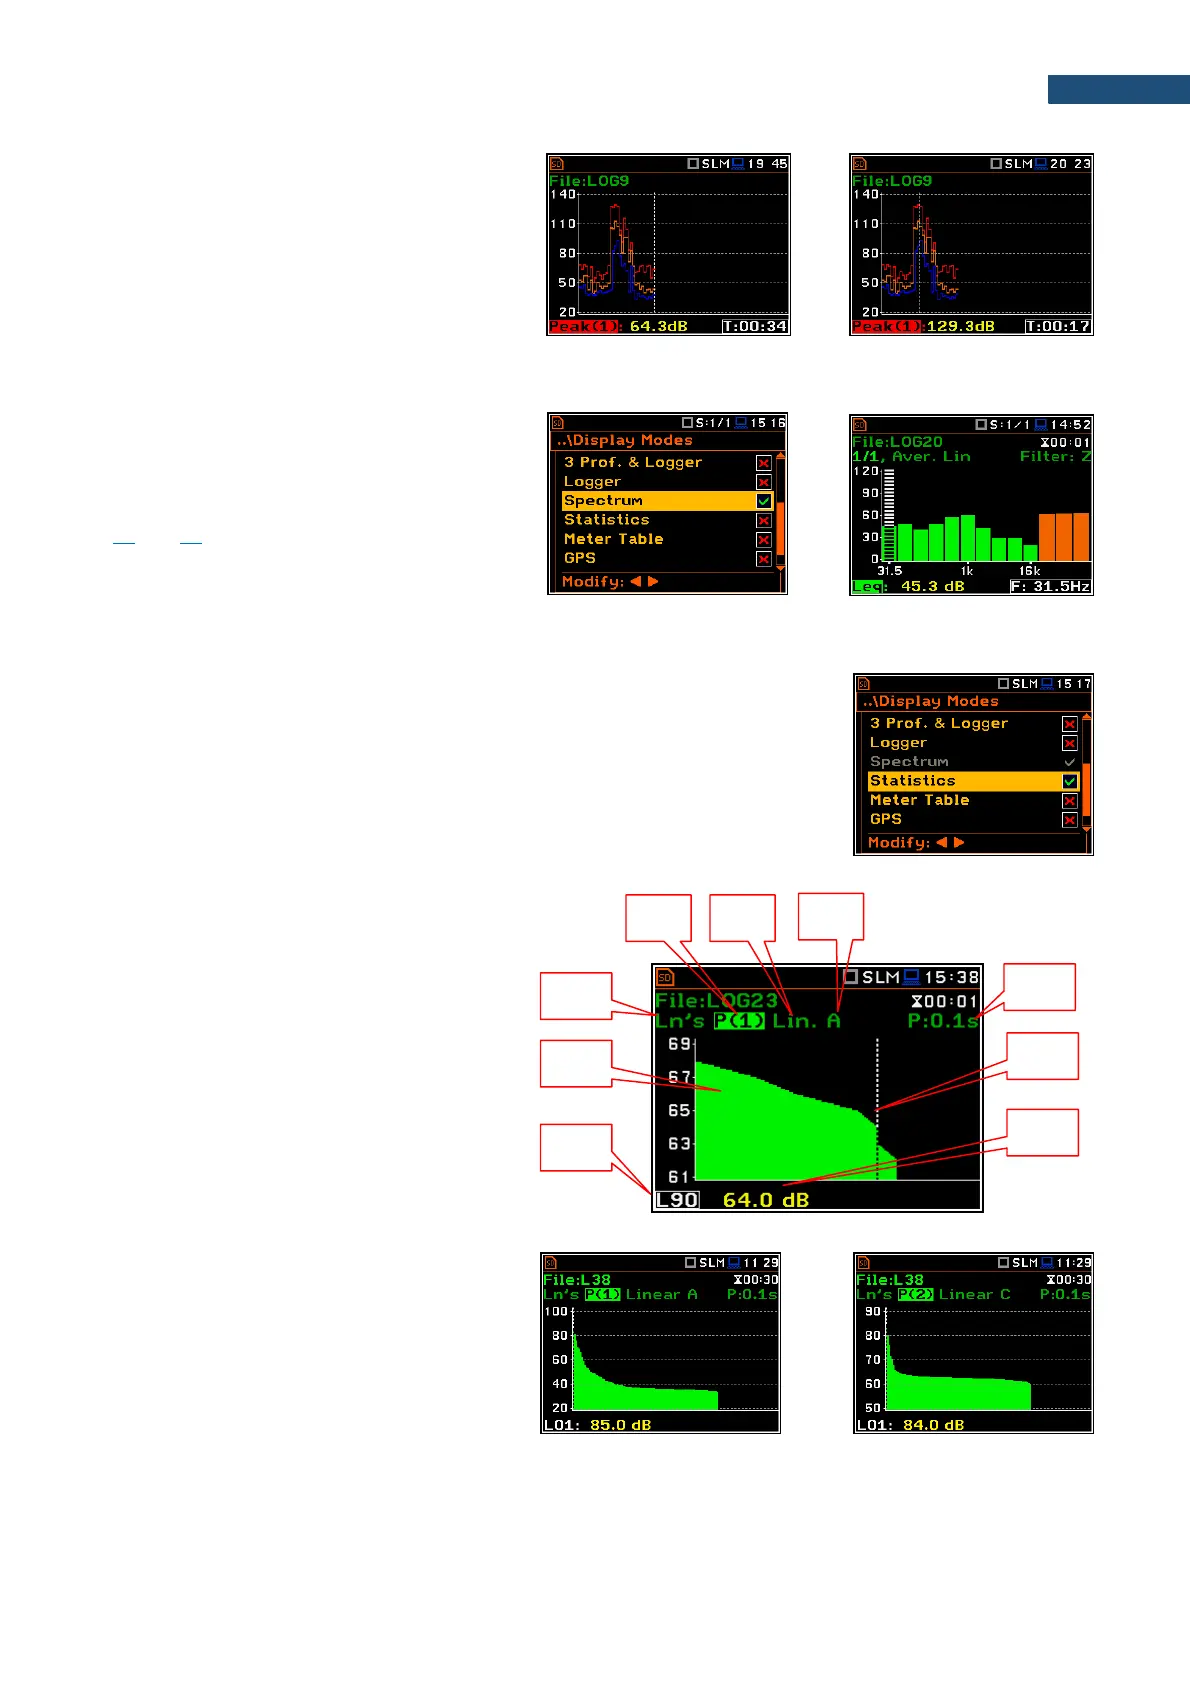
Statistics view fields
1. Result name
2. Statistics plot
3. Statistical level (Lnn percentile value) for
the active cursor position
4. Active profile (P1, P2 or P3)
5. RMS detector (Lin. or Fast, Slow, Imp.)
6. Weighting filter (A, B, C, Z, U, UA or LF)
7. Sampling interval for the Lnn values
calculated by the instrument (0.1 s)
8. Cursor position
9. Value of the selected statistical level Lnn
and units (dB)
The profile is changed with the ◄ / ► key
pressed with <Alt>.