SVAN 977A User Manual - Appendixes
D.1.2 Definitions and formulas of SLM results
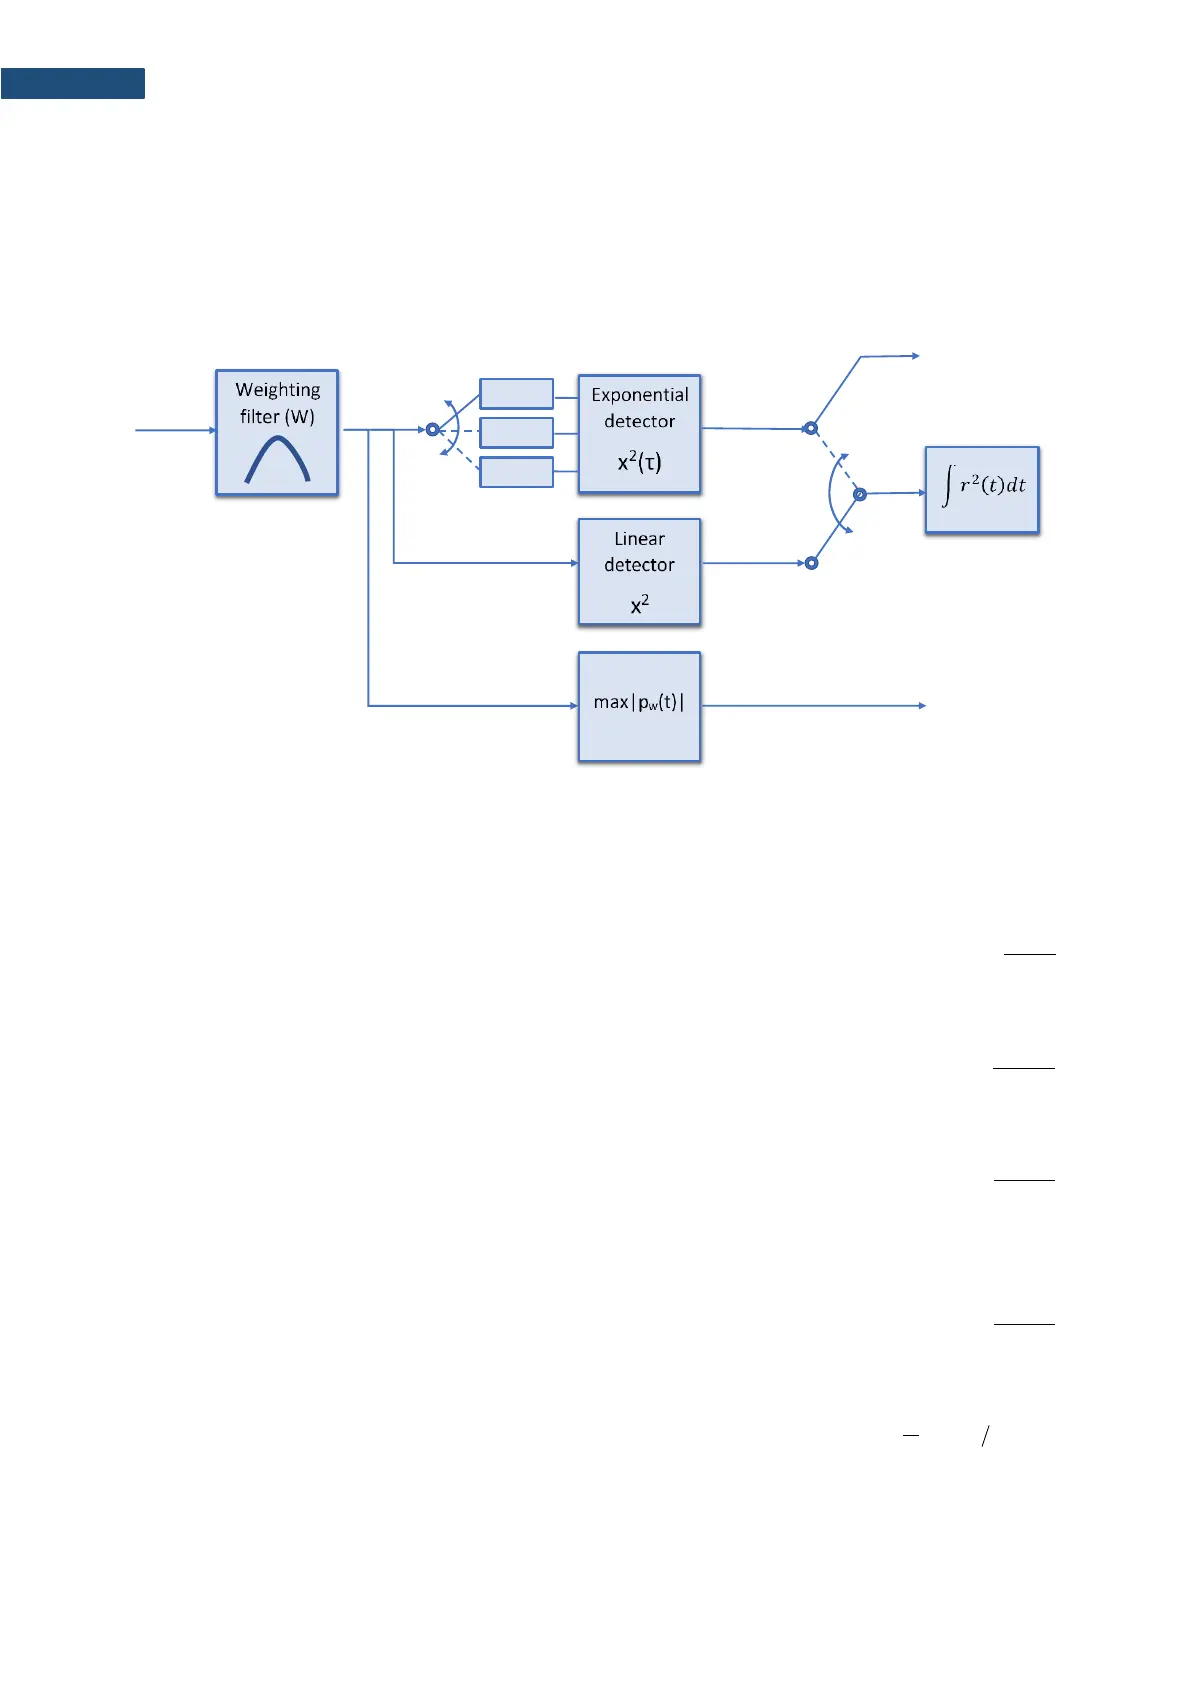
The instrument calculates the sound measurement results for three profiles. The calculation flow diagram
for one profile is presented below:
Percentage of the overloaded input signal, which occurred during the current time period of
the measurement (T)
Peak sound level is calculated for the given T
( )
=
2
0
2
W
p
tp
maxlog10Peak
T
Maximal value of the frequency and time-
weighted sound pressure level for the last
second of the measurement
( )
=
2
0
2
W
1
p
tp
maxlog10Spl
T
Maximal value of the time-weighted sound
pressure level for current time period of the
measurement (T). The Max result for the 1
second period is equal to the value of the Spl
result
( )
=
2
0
2
W
p
tp
maxlog10Max
T
Minimal value of the time-weighted sound
pressure level for current time period of the
measurement (T)
( )
=
2
0
2
W
p
tp
minlog10Min
T
Leq
(equivalent
sound level)
Time-averaged sound level for current time
period of the measurement (T)
( )
( )
=
T
0
2
0
dtptr
T
1
log10Leq
Lmax, Lmin, Spl,
Ltm3, Ltm5