You can shift the Y-axis in the spectrum view
with the <Shift> and ▲ / ▼ keys pressed
together.
You can change the cursor position with the
◄ / ► key. You can jump to the first or last
spectrum line with the <Shift> and
◄ / ► keys pressed together.
The band central frequency and the
appropriate value are presented in the line
below the plot.
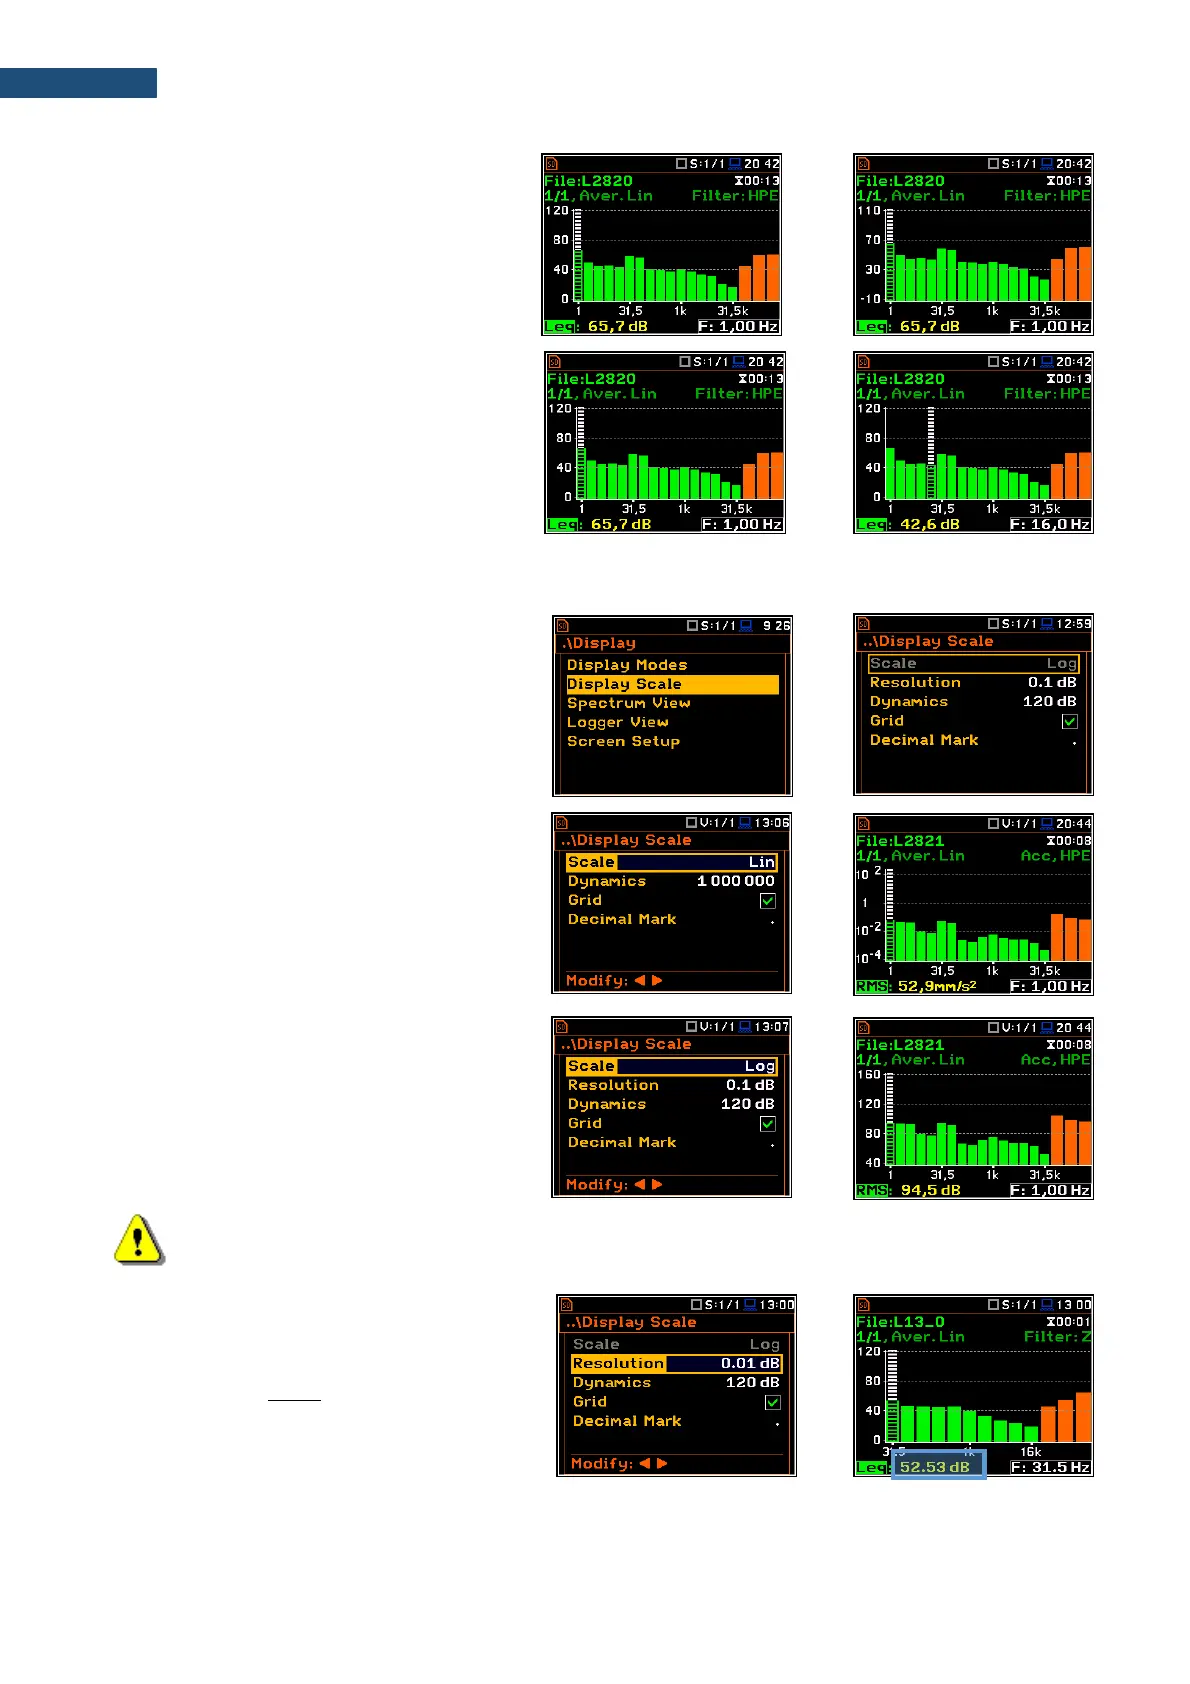
10.3.2 Adjusting scales of the spectrum plot – Display Scale
The Display Scale screen allows to define
the result units (absolute or logarithmic),
adjust scale of plots and toggle the grid.
Scale of results presentation
The Scale parameter defines results units:
linear (Lin – m/s
2
, m/s etc.) or logarithmic
(Log - dB).
For sound measurements, the Scale position
is not active. All results are always presented
in dB.
The Log option means that the graphical
presentation is given in the logarithmic scale
and the measurement results are expressed
in decibels (the result is related to the values
set in the Reference Levels screen (path:
<Menu> / Auxiliary Setup / Reference Levels).
Note: In Vibration modes, results can be presented in the Logarithmic (dB) or Linear (for example,
m/s
2
) units. It depends on the Scale parameter value. For example, 10 m/s
2
can be presented also
as 140 dB.
Resolution
The Resolution position defines how many
digits after point are to be presented in the
Leq/RMS value - field 3.