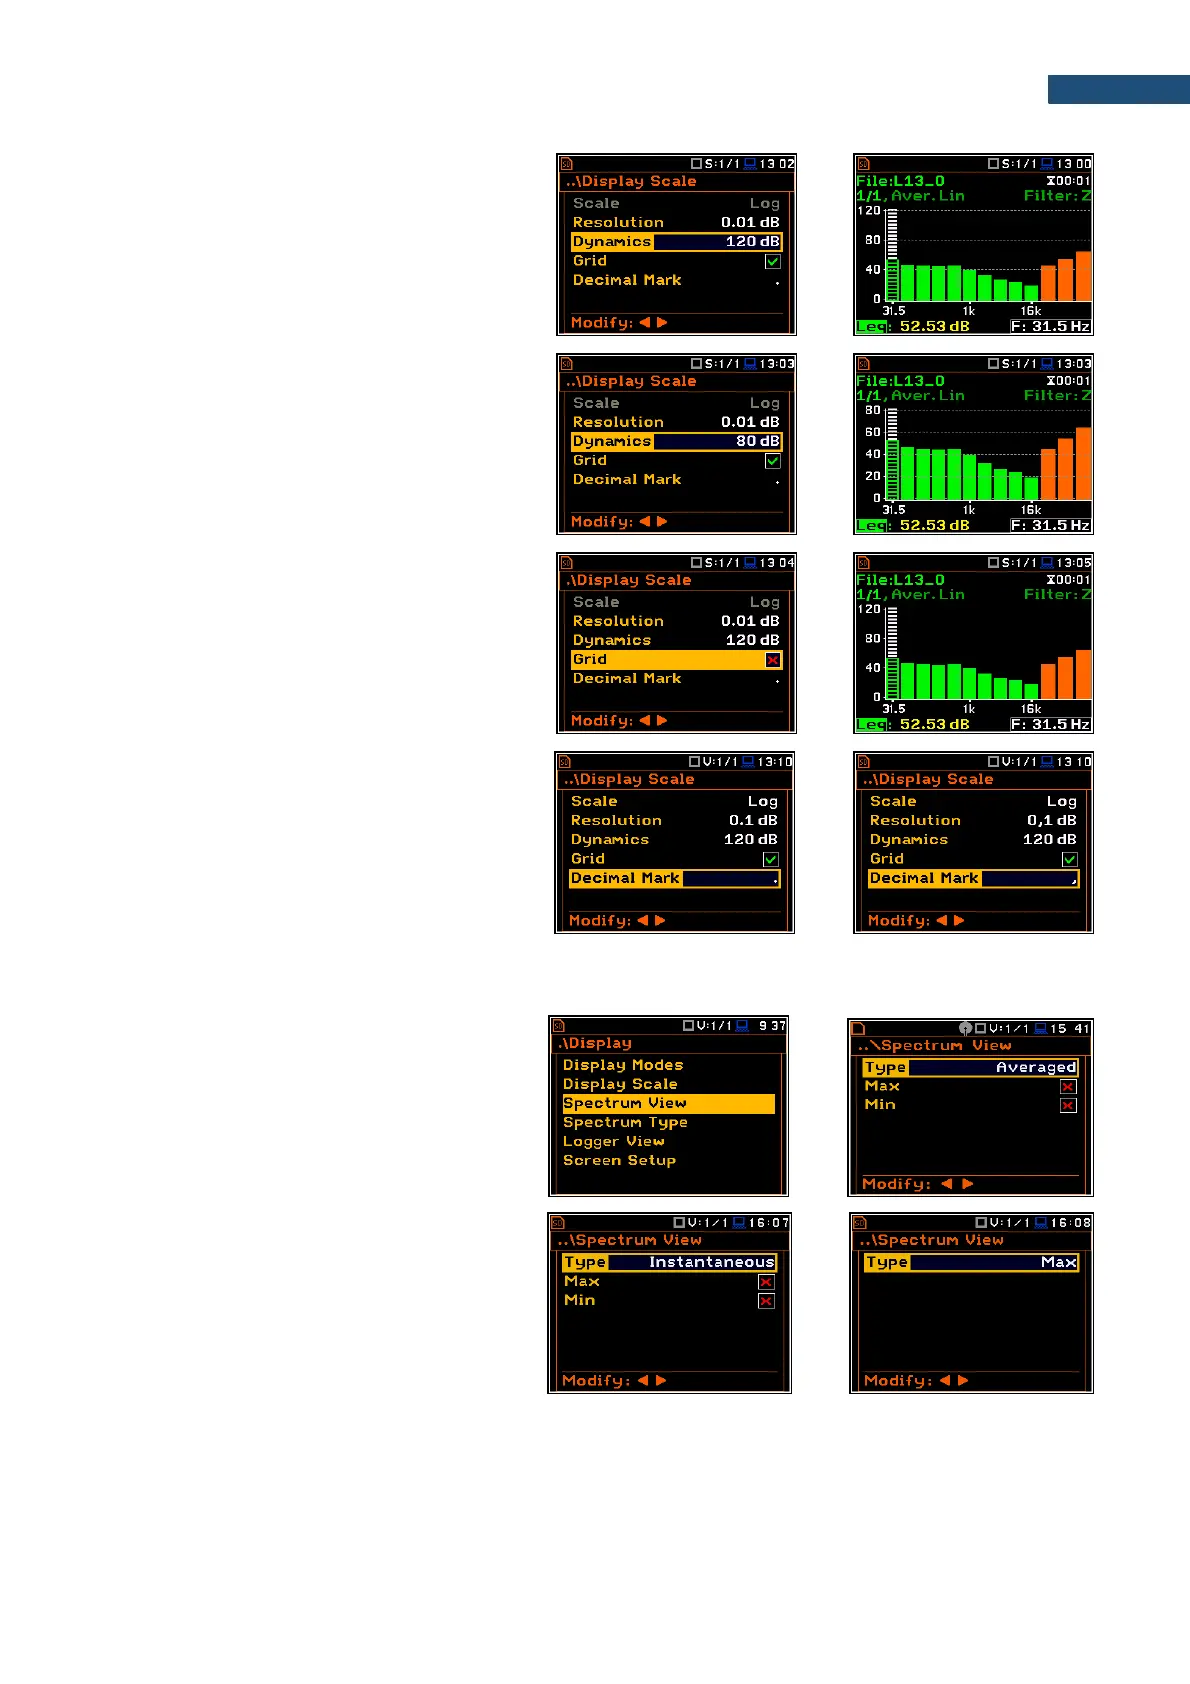
Scaling the vertical axis of the plot
The Dynamics parameter defines the
dynamic range of the Y-axis scale.
It is possible to select the range from the set:
10dB, 20dB, 40dB, 80dB, 100dB and 120dB.
Toggling the grid
The Grid position allows to toggle the
horizontal grid lines of the logger or spectrum
plot.
Decimal Mark
The Decimal Mark position allows to select
which decimal mark (point or comma) will be
used for data presentation in all views.
10.3.3 Selecting spectra to be viewed - Spectrum View
In the Spectrum View screen, you can select
the different spectra to be viewed in the
Spectrum display mode: instantaneous,
averaged, maximum or minimum.
In the Type position, you may choose the
spectrum type to be presented as a bar plot in
the Spectrum view: Averaged,
Instantaneous, Max or Min.