4.10. User Interface Overview
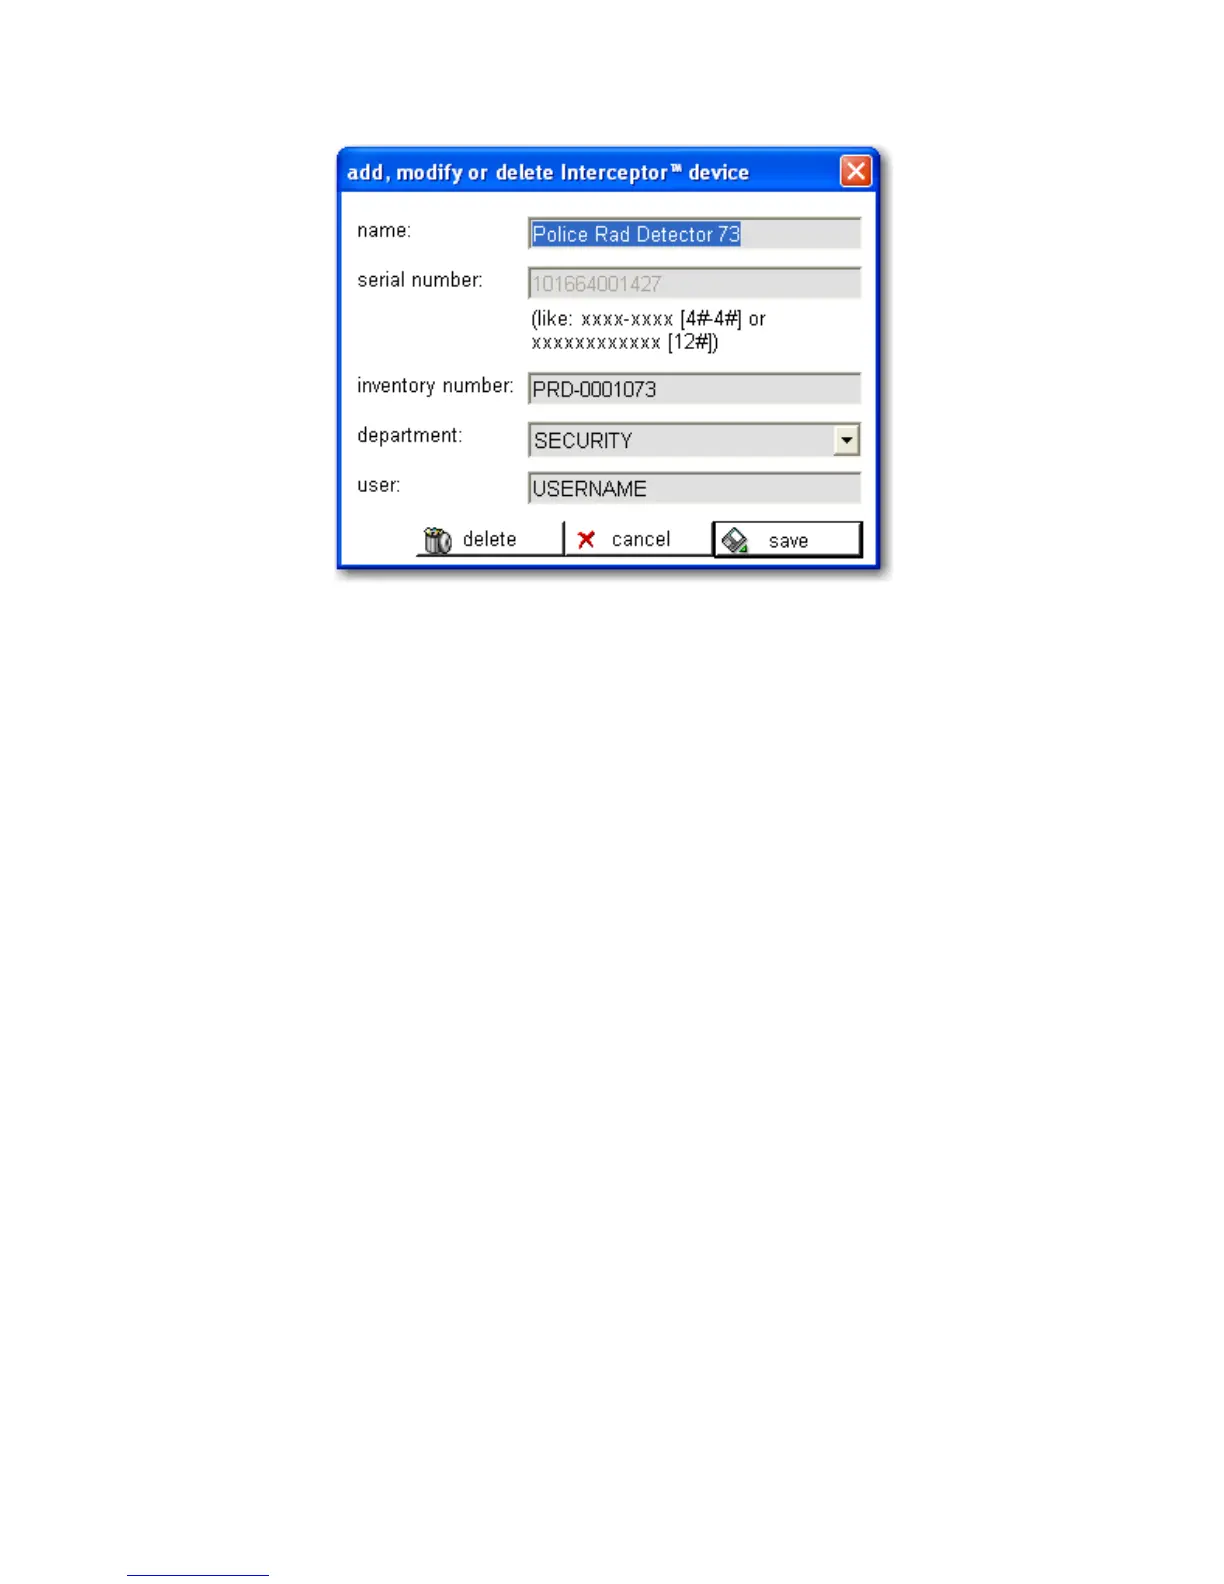
Figure 4-11. PC Software - Device Definitions
4.10.2 Selected Device History (B)
Click and drag on the top-right area of the interface (B) plot to detail the
device history graph of a selected I™ unit.
HISTORY
This history includes logged data about recorded dose rate, neutron counts
and other device parameters. Clicking upon any point within the count/dose
rate plot of this history will display the exact magnitude at the exact time the
measurement was acquired at the specified point. Events like recorded spec-
tra, voice messages and images are displayed according to recording times
with a small symbol. A detailed report for each event can be opened by click-
ing on the symbol. The history log file can be imported into a spreadsheet
(i.e. Microsoft® Excel®) and processed to generate further reports. Each en-
try is represented by one line in the log file having an exact time-stamp. Both
log-files are located in the corresponding I™ unit’s subdirectory,
as defined by the file structure system of the I™ Sync applica-
tion. (See Preferences for setting the root directory for the application file
Thermo Fisher Scientific Interceptor™/en/5.1(4956)/Feb2010 71