376 EN MEDUCORE Standard
2
WM 68401 04/2021
18 Technical data
18.11 CARDIOlogic ECG analysis system
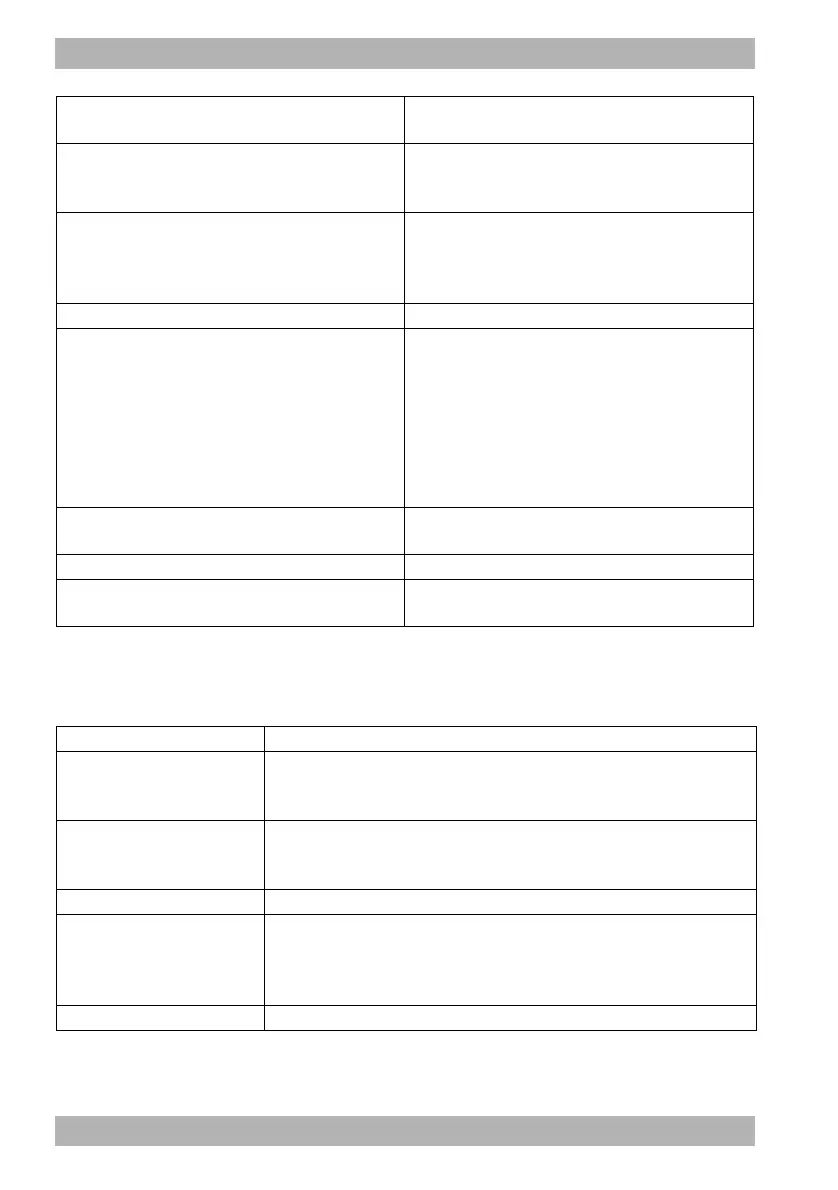
Response time of heart rate display:
Steep rise
Steep drop
80/min to 120/min: 4.5 s
80/min to 40/min: 8 s
Displayed heart rate for varying ECG complexes
according to 60601-2-27, Section 201.7.9.2.9.101
• Signal A1: 40/min
• Signal A2: 30/min
• Signal A3: 60/min
• Signal A4: 70/min to 95/min
Recovery time after a defibrillation shock 3 s
Band width:
ECG in monitor mode
ECG in 12-lead ECG function mode
0.03 Hz to 150 Hz (ECG leads I, II, III, aVR, aVL, aVF,
V1, V2, V3, V4, V5, V6)
0.34 Hz to 45 Hz (Pad ECG lead)
0.03 Hz to 50 Hz or 0.03 Hz to 150 Hz for all ECG
leads displayed (depending on setting in user menu)
Protection against malfunction caused by
electrosurgery
Yes
Leakage currents Leakage currents may add up.
Feed rate of ECG curve (display and printout)
6-lead ECG: 12.5 mm/s, 25 mm/s, 50 mm/s
12-lead ECG: 25 mm/s, 50 mm/s
Specification
6-lead ECG monitoring/12-lead ECG
recording and assessment
Specification ECG analysis system
Analysis time (VF/VT)
• Duration of analysis in AED mode: 8 s under typical conditions
• Duration of analysis for VF/VT alarm: 8 s with continuous
measurement
ECG derivation used for
analysis
Lead II of the defibrillation electrodes is primarily used for analysis. If the
defibrillation electrodes are not connected, lead II of the ECG electrodes is
used.
Impedance measurement Checks electrode contact
Response to implanted cardiac
pacemakers
Pulses from implanted pacemakers may affect or prevent correct detection
of arrhythmia. As a result, not all rhythms which can be defibrillated may
be detected, and the device may not recommend shock delivery under
certain circumstances.
Asystole threshold 0.2 mV
 Loading...
