892 J006 MNAH | PGC5000 G EN 2 | 43
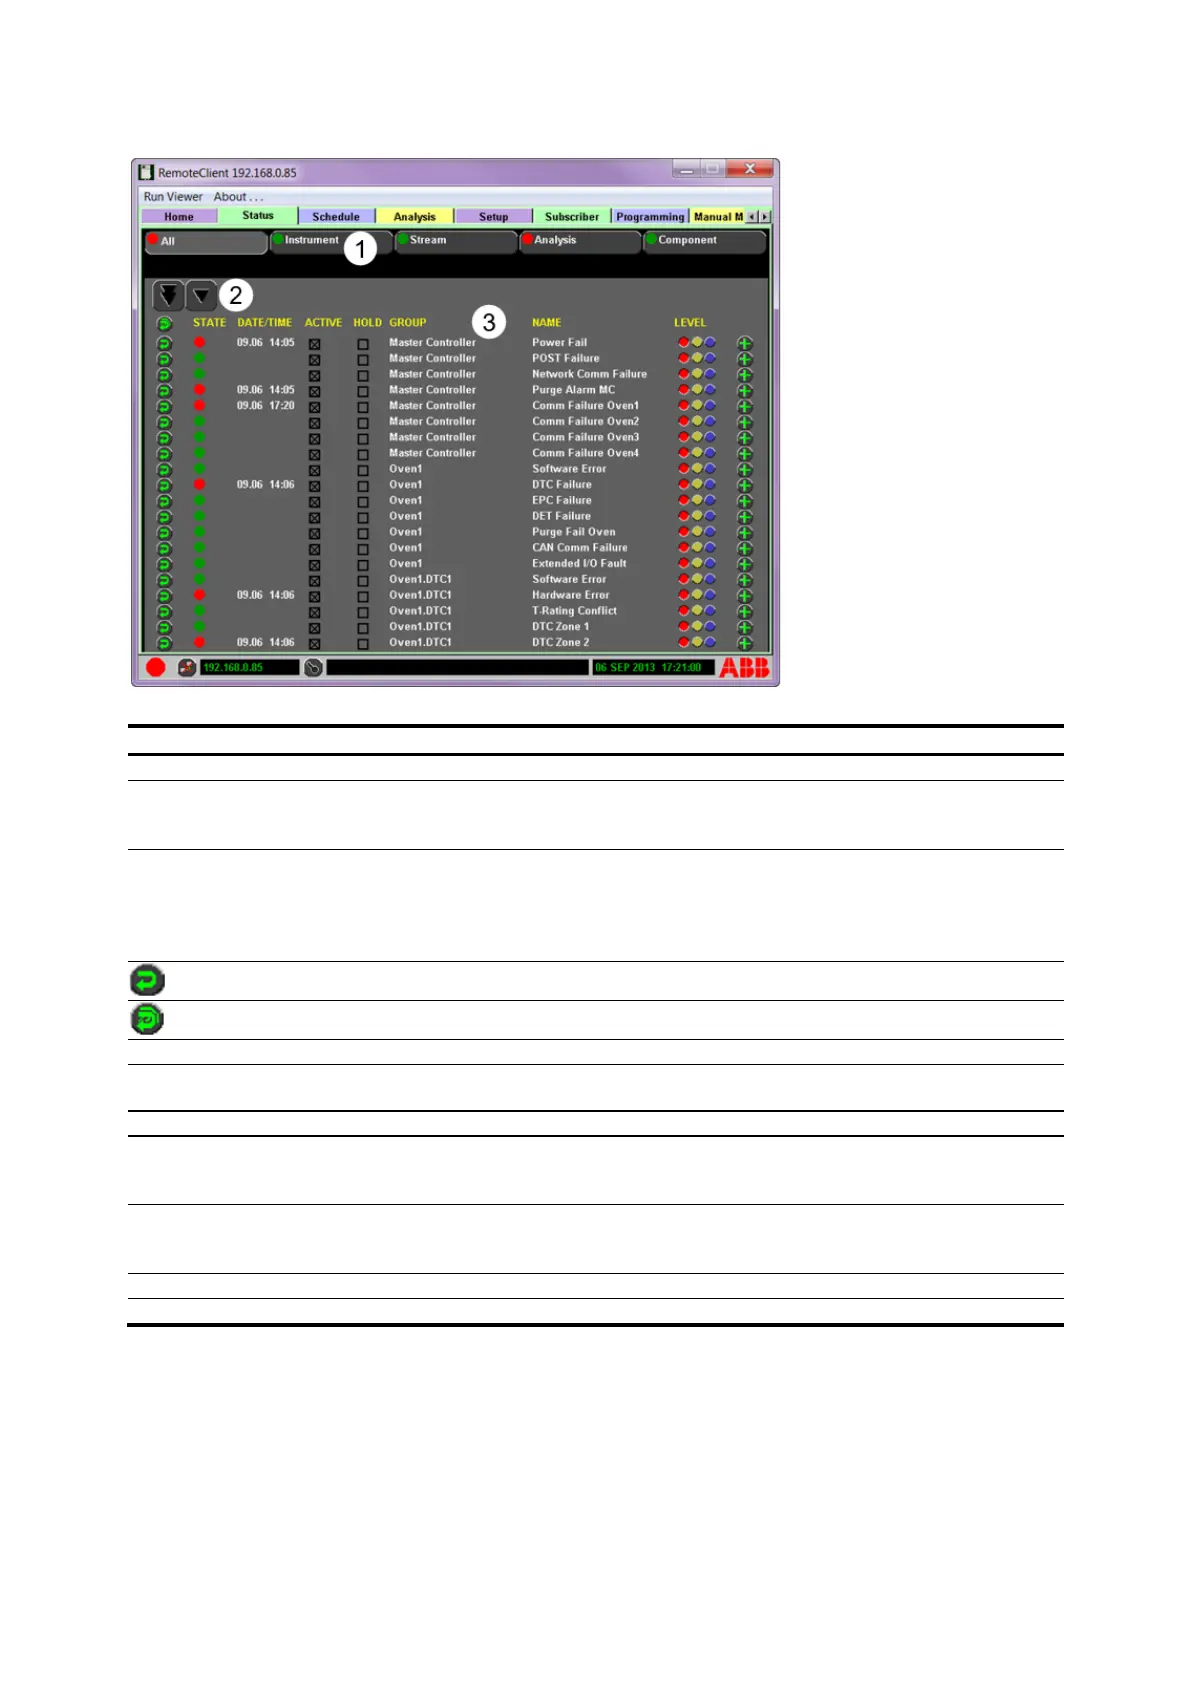
Figure 4-9: Status Screen Example
Legend: Status screen example
Scopes – Use to navigate between All and user-configured scopes.
Page Up/Down and Line Up/Down – Press to move vertically through indicators.
Depending on location or size of the list, movement arrows may not be shown. (Example:
top of list, page up arrows will not be shown.)
Indicators– Display individual indicator information including current state, name, and
group. The user can reset, activate/de-activate indicators, set indicators to hold until
manually reset and change alert level. All available indicators are configurable to one or
more of the Condition Monitoring System scopes. Indicator colors signify the status of the
indicator: green (normal), yellow (warning), red (alarm), or blue (information only).
Reset single indicator and time stamp
Reset all indicators and time stamps displayed
The current state of the active indicator is represented by the color-coded status button.
Displays date and time the indicator was triggered; date in Month/Day/Year format and
time in 24 hour format
User-selectable; indicator is active if marked, inactive if not marked
User-selectable; if marked, indicator holds value until manually reset; if not marked,
indicator holds until the absence of condition that triggered the indicator or until manually
reset
Name of indicator’s hardware or software group. Note that “Master Controller” is shown
for SBC-related indicators, whether the SBC is located in a PGC5000A Master Controller or
in an Oven with Integrated Controller.
User-selectable level button: Red = Alarm, Yellow = Warning, Blue = Information Only.
The Status Tab gives access to configuration, evaluation, and monitoring of the PGC5000 Condition
Monitoring System. The Status Tab is used to collect additional information of the analyzer system’s
Condition Monitoring System. The analyzer system reports indicators through multiple means
including: visual, color-coded indicator status icons, analysis reporting, OPC servers, and other
communication media.
The All subtab is a complete listing of available indicators for that specific analyzer’s Condition
Monitoring System. The four remaining subtabs: Instrument, Stream, Analysis and Component are
user-configurable scopes.