892 J006 MNAH | PGC5000 G EN 2 | 51
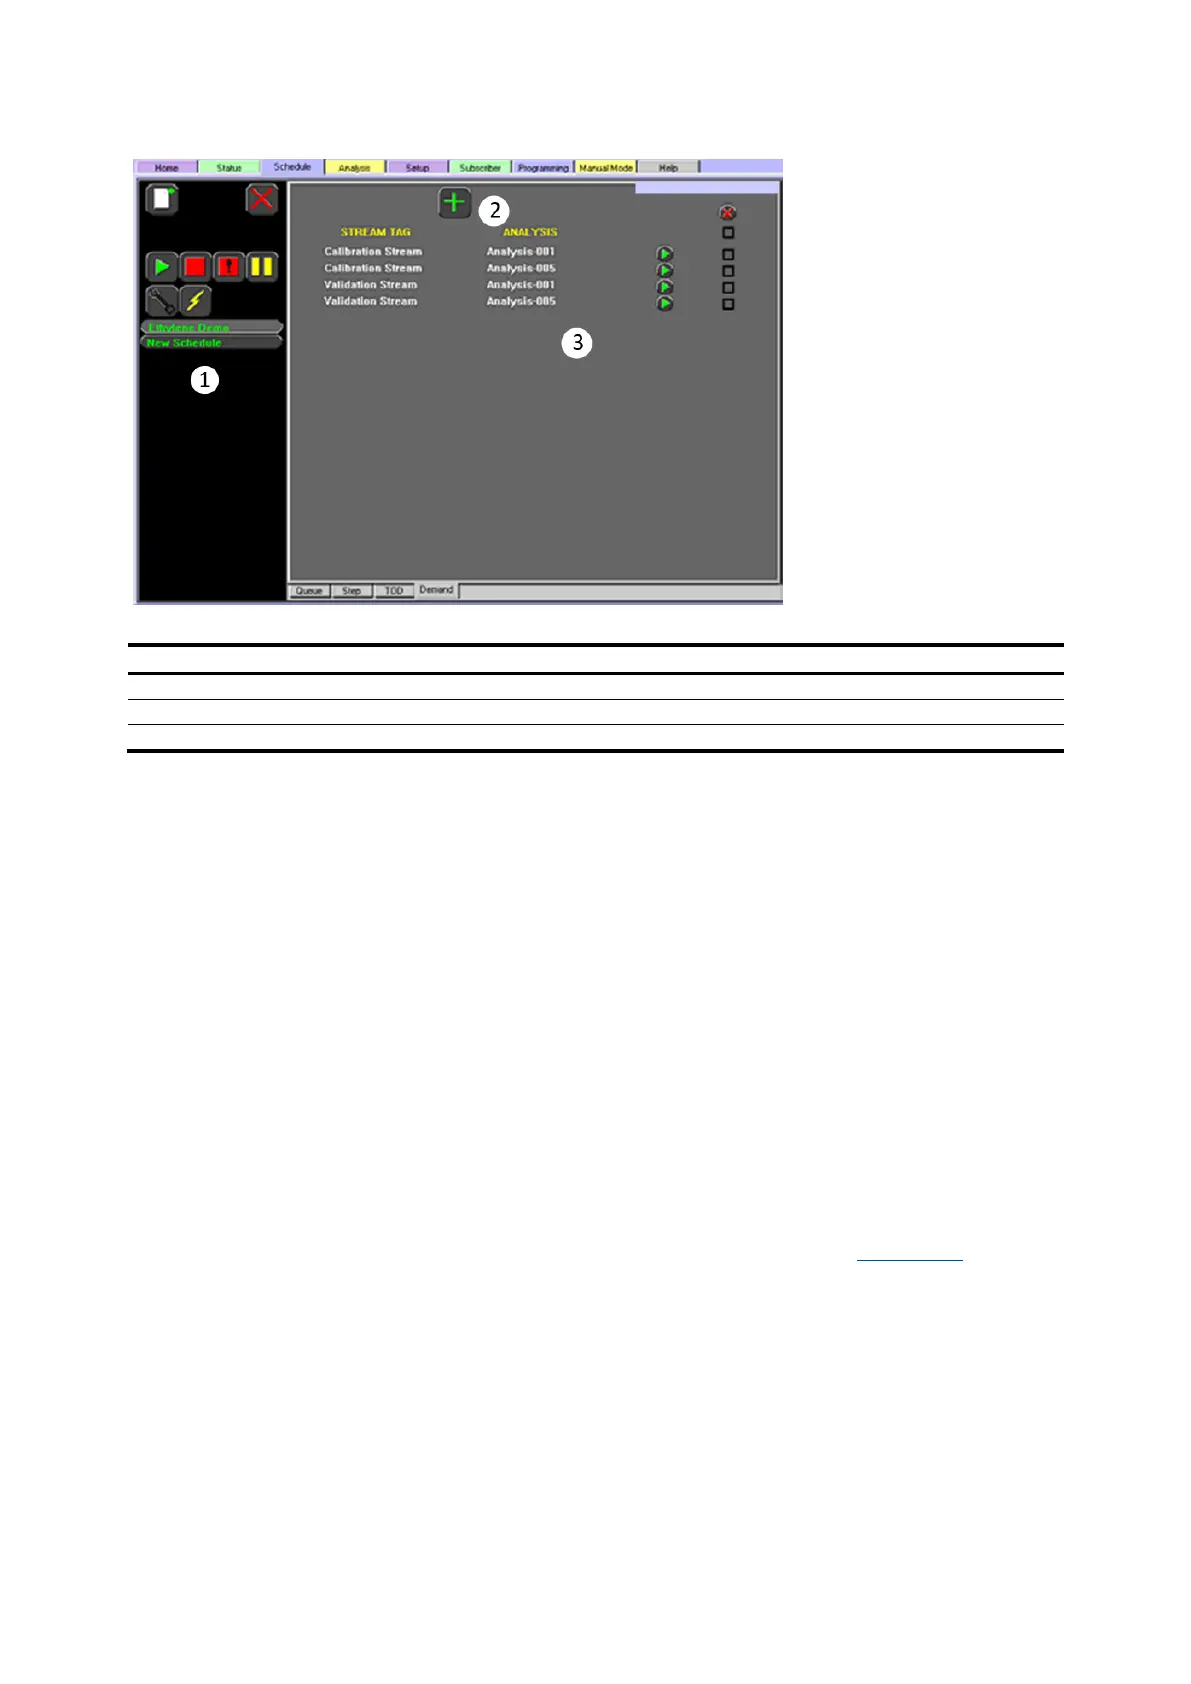
Figure 4-16: Schedule>Demand subtab
Legend: Schedule>Demand subtab
To create a demand analysis:
1. Press the Add icon at the top of the subtab display. A selection list appears.
2. Select the desired stream from the list and press the Next button to continue.
3. Select the analysis from the list and press the Next button to continue. If needed, press the Go
Back button to return to the previous screen.
4. Review the information and press the Accept button to complete the request or press the Abort
button to discard. If needed, press the Go Back button to return to the previous screen.
5. To add the analysis to the queue, press the Run Analysis on Demand button associated with the
name of the analysis.
The analysis is placed as close as possible to the top of the queue. A Demand request does not
replace the current or purging stream analysis in a running schedule.
4.5 Analysis tab
The Analysis Tab presents the tools for creating and editing analyses in either text or graphical
format.
The Analysis Tab has three subtabs: Chart, Tabular Editor, and Overlay and Report (only for
reprocessed reports). It is the starting point for building, editing, and saving analyses and their
building blocks.
4.5.1 Chart subtab
The Analysis>Chart subtab is used to display and edit analyses graphically (see Figure 4-17). The
parallel lines with the colored symbols at the bottom of the chart screen graphically identify analysis
objects.