52 | PGC5000 GEN 2 | 892 J006 MNAH
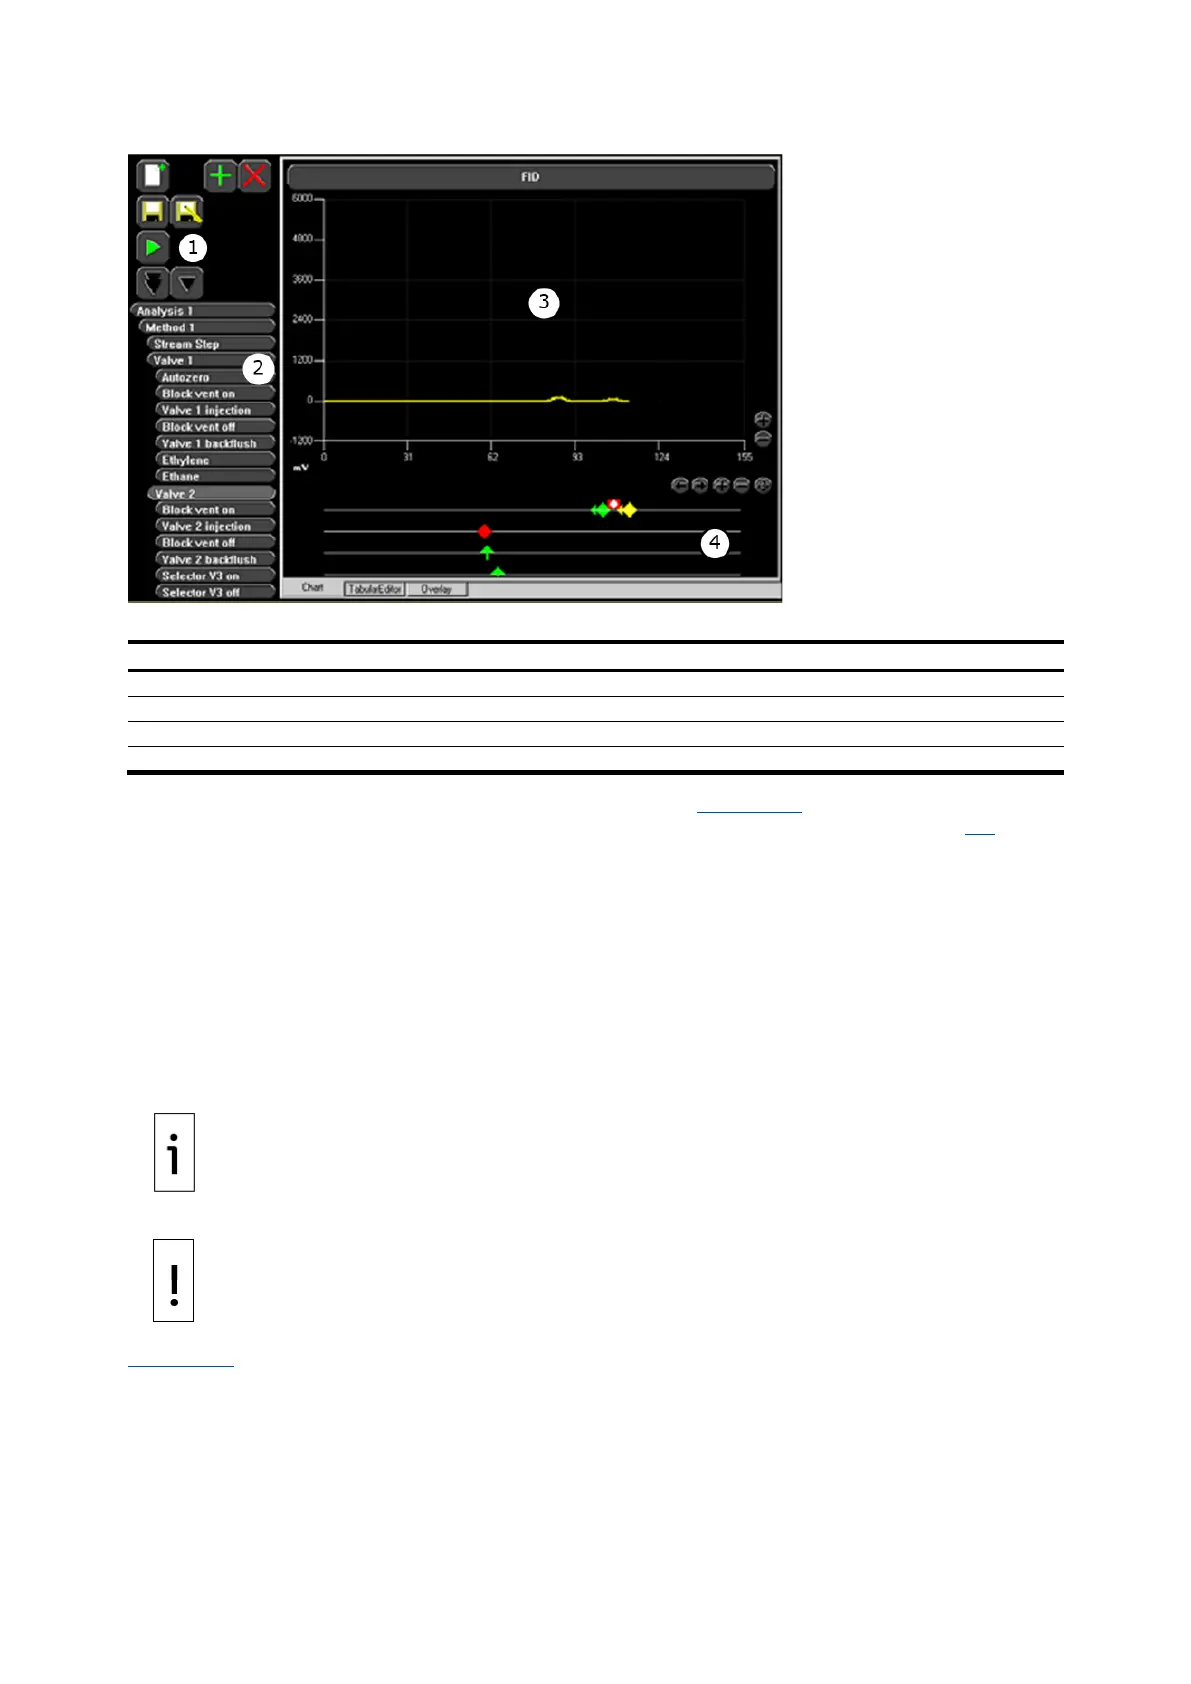
Figure 4-17: Analysis>Chart Subtab
Legend: Analysis>Chart Subtab
Action icons: Used for retrieving saved analyses and editing the displayed analysis
Function select buttons: User-created analysis objects
Chromatogram display: Displays current chromatogram and/or overlay
Graphic edit area: Drag and drop objects to edit the selected object's timing.
Enable the graphical editor by selecting the Chart subtab (see Figure 4-17). This editor allows analysis
timing adjustment using a pointing device with the drag and drop function. Refer to section 5.5 for a
complete list of TCFs and their functions.
To edit an analysis graphically:
1. Press the Add icon to load an analysis from the library. The analysis is displayed in the Analysis
display area.
2. If needed, select the detector from the drop-down menu at the top of the chromatogram
display area.
3. Select an element of the analysis. The symbol for the selected element is always displayed on
the second horizontal line from the top, below the chromatogram display area.
4. Select the object to adjust by placing the cursor on the symbol.
5. Hold the cursor button at the LUI (left mouse button at the RUI), move the object to the
desired location, and release the cursor button.
IMPORTANT NOTE: To see the object’s timing represented numerically, select the Tabular Editor
subtab.
NOTICE – Equipment damage or loss of data. Use caution when editing preconfigured
Analyses, Methods, and Sequences. Use “Save As” under a different name prior to testing
since changes made and saved affect all analyses, methods and sequences using that
named object.
Figure 4-18 shows the corresponding placement of symbols on the Chart subtab in relation to the
numbers entered from the Tabular Editor subtab. Placement of the symbols can be edited from either
subtab.