892 J006 MNAH | PGC5000 G EN 2 | 41
5. Select Raw to view in raw data format.
To view a stored report:
1. Ensure the Previous box is cleared and select the Raw box if raw data is preferred.
2. Select the Stream from the first drop-down list.
3. Select the timeframe from the second drop down list. Standard analysis data is saved in hourly
folders in Year/Month/Day and Hour format or alarm reports for the select stream.
4. Select the report inject time to view. Reports are saved by inject time in the following format:
TYPE/Year/Month/Day/Hour/Minute/Second (STD201507301629).
5. View the data (see Figure 4-6).
4.2.4 Overlay subtab
The analyzer supports the overlaying of stored chromatograms on the screen for use as a reference. A
maximum of two stored chromatograms can be viewed simultaneously on the Chart Subtab, plus the
active stream.
IMPORTANT NOTE: If the analysis is not currently running, select Idle Stream to retrieve data
about that analysis.
The Home>Overlay subtab displays the choice of Overlay 1 and/or Overlay 2. Both overlays allow
selection of chromatograms saved on the SBC (see Figure 4-7).
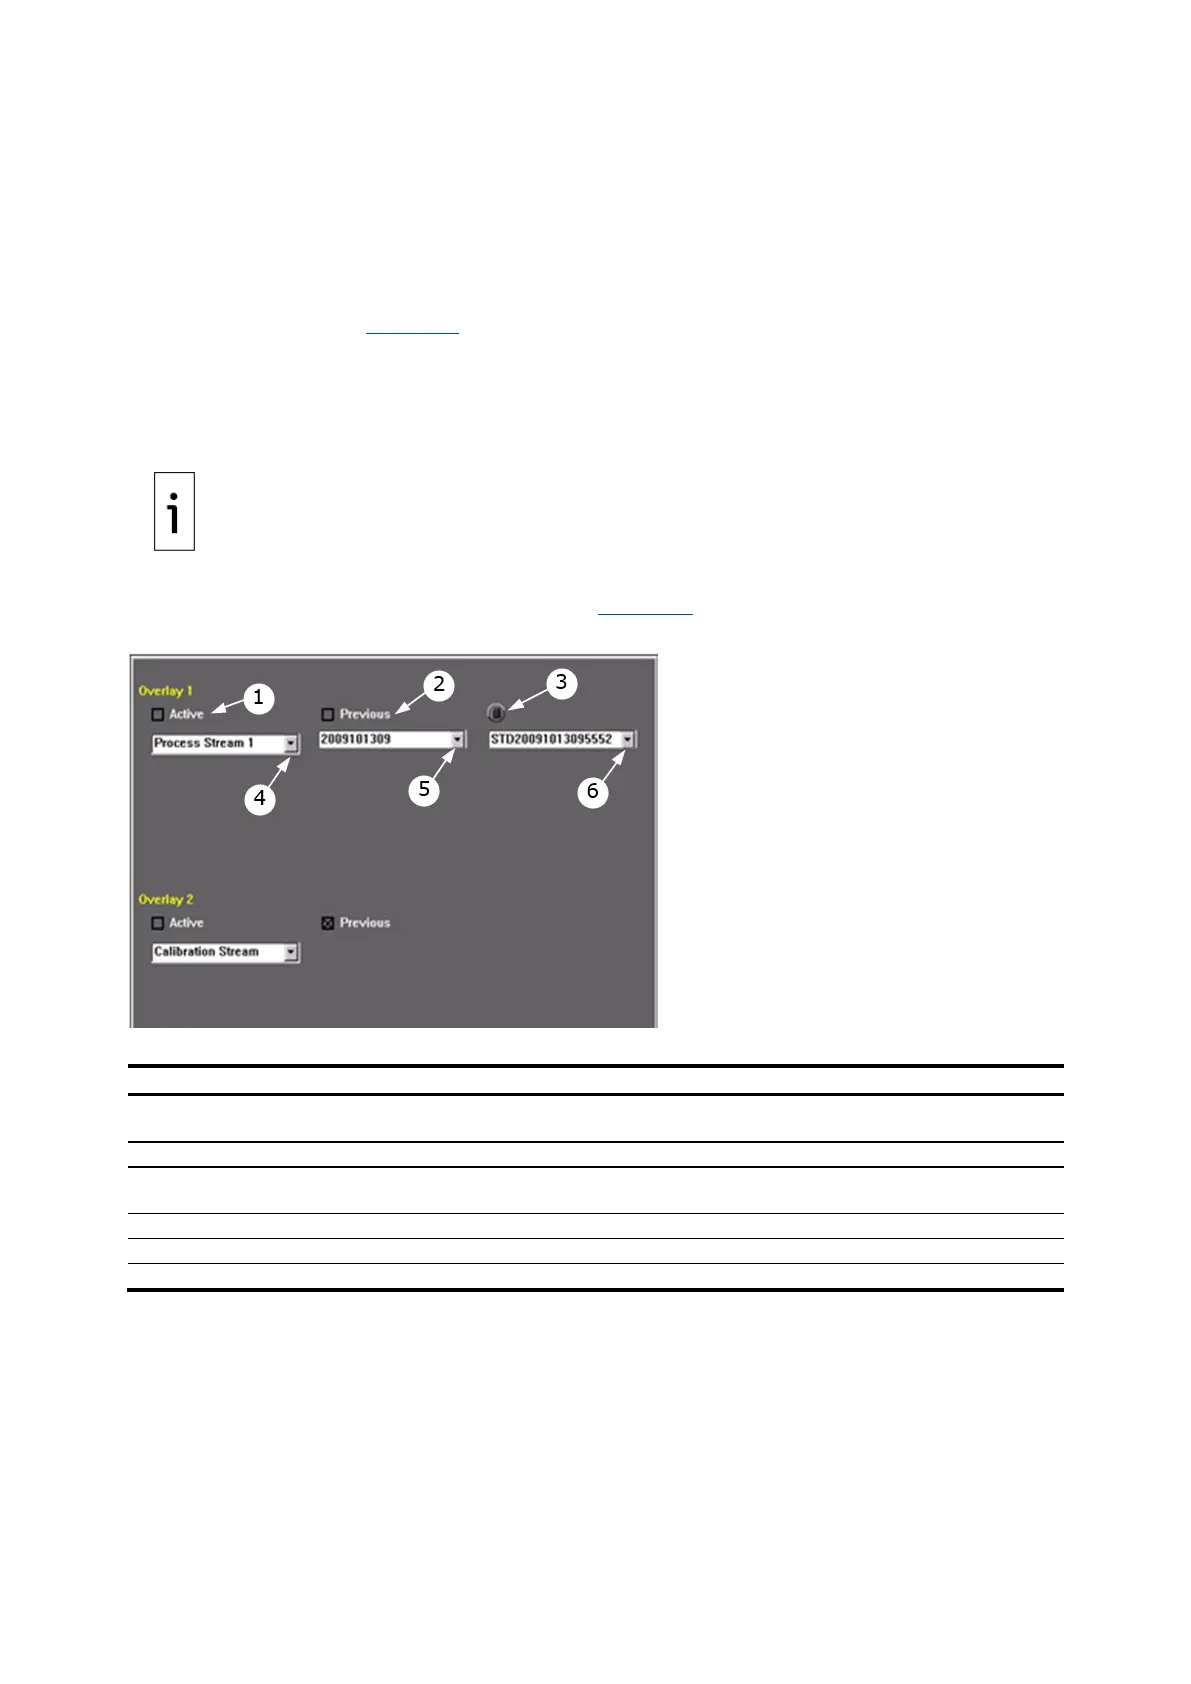
Figure 4-7: Home>Overlay Subtab
Legend: Home>Overlay Subtab
Active – Check to make the overlay viewable on the chart screen.
Overlay 1 – Green; Overlay 2 - Red
Previous – Selects chromatogram from the selected stream’s last completed analysis
Lock – Press to lock the selected chromatogram (keeps the chromatogram from being
overwritten).
Stream selection – Select stream to display: Calibration, Validation, or Named Stream.
Group selection – Select locked, alarm, reprocessed, or by time frame.
File Selection – Select file by inject time.
To select a chromatogram to overlay:
1. Press the Home>Overlay subtab.
2. Either press Previous for the last completed analysis, or clear the Previous box to select a
stored chromatogram.
3. Select the year (YYYY), month (MM), day (DD) and hour (HR). Format: YYYYMMDDHR.
4. Select the File from the last drop-down menu. Format: YYYYMMDDHRXXXX where XXXX is the
minute and second the cycle started.
5. Check the Active box.
6. Repeat steps for the second chromatogram, if desired.
7. Return to the Home>Chart subtab to view the overlays.