40 | PGC5000 GEN 2 | 892 J006 MNAH
allow storage of new data, allowing continual data collection. The last five calibration, validation and
alarm reports are retained, independent of time stamp.
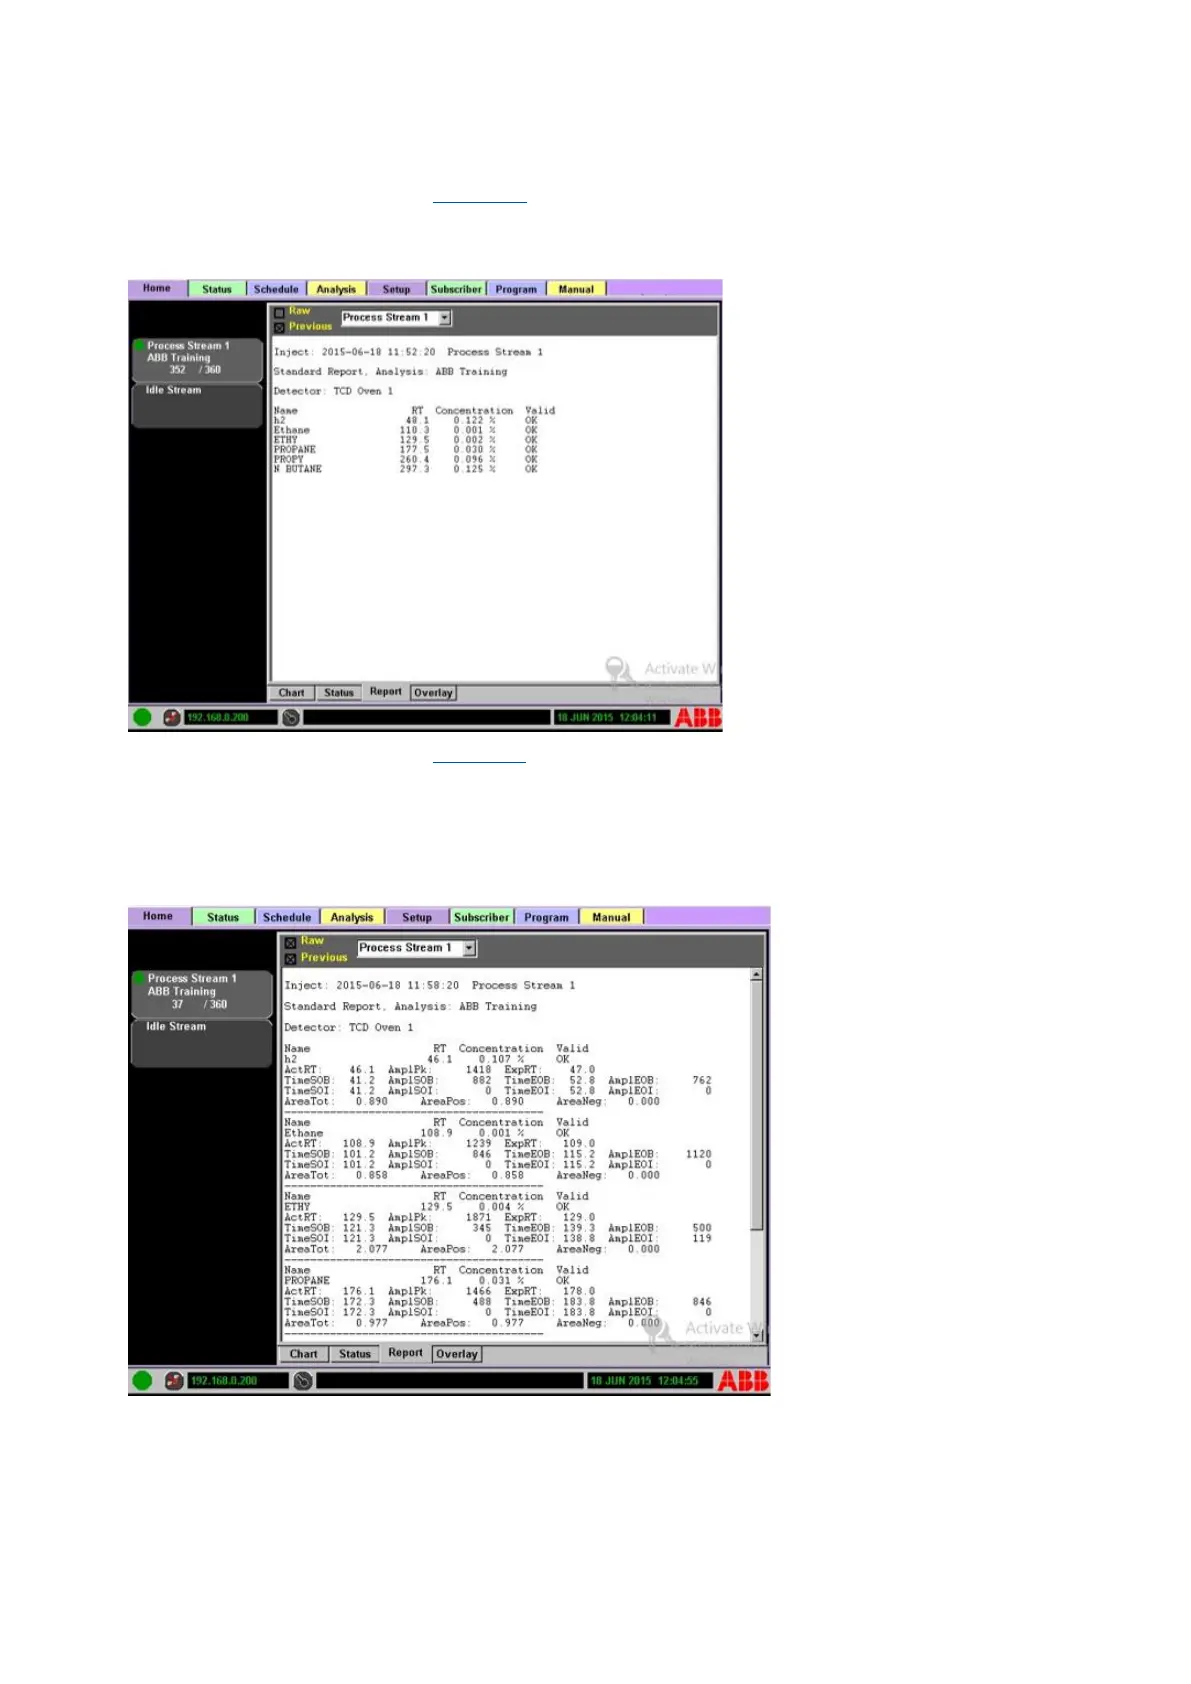
⎯ The standard report (see Figure 4-5) displays inject time, sample stream, analysis name,
report type, detector, component Name / Retention Time / Concentration and validity of the
component.
Figure 4-5: Standard report format
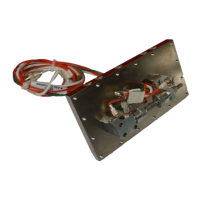
⎯ The raw data report (see Figure 4-6) displays the actual value of software-determined points
on the chromatogram in addition to the information displayed in the standard report format.
The times shown are in seconds from the start of the method. The amplitudes are in 0.1
microvolt units. The Start of Baseline / End of Baseline amplitudes are relative to electrical
zero. The other amplitudes are relative to the computed baseline. Areas are in millivolt-sec
units.
Figure 4-6: Raw Data Report Format
To view the last saved report by stream:
1. Select the analysis from the list on the left.
2. Select the Previous report box.
3. Select the stream.
4. View the report.