892 J006 MNAH | PGC5000 G E N 2 | 9
—
List of figures
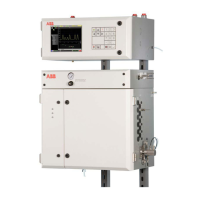
Figure 1-1: Standard PGC5000 with ovens connected by switch ................................................... 15
Figure 1-2: Oven with integrated controller connections .............................................................. 16
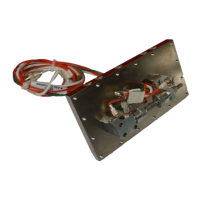
Figure 2-1: Liquid Sample Valve ............................................................................................... 21
Figure 2-2: Inside the Master Controller .................................................................................... 22
Figure 3-1: Master Controller ................................................................................................... 24
Figure 3-2: Basic Analyzer Screen Layout .................................................................................. 24
Figure 3-3: System Information Bar ......................................................................................... 26
Figure 3-4: Master controller keypad ........................................................................................ 27
Figure 3-5: Virtual keyboard .................................................................................................... 27
Figure 3-6: Typical ovens ........................................................................................................ 28
Figure 3-7: Leak Check Oven Example ...................................................................................... 29
Figure 3-8: Setup Tab, showing calibration concentration ............................................................ 30
Figure 3-9: Home screen, showing IP address ............................................................................ 32
Figure 3-10: Home screen, showing “Local” ............................................................................... 32
Figure 3-11: Home Screen, showing IP address dialog box .......................................................... 33
Figure 3-12: Network disconnect button .................................................................................... 33
Figure 3-13: Connect Dialog Box .............................................................................................. 33
Figure 3-14: Connect box, showing analyzer name ..................................................................... 34
Figure 3-15: Disconnect dialog box ........................................................................................... 34
Figure 3-16: Select a user name .............................................................................................. 35
Figure 4-1: Chart subtab ......................................................................................................... 37
Figure 4-2: Zooming an Area ................................................................................................... 37
Figure 4-3: Home>Status screen .............................................................................................. 38
Figure 4-4: Home>Report subtab ............................................................................................. 39
Figure 4-5: Standard report format........................................................................................... 40
Figure 4-6: Raw Data Report Format ......................................................................................... 40
Figure 4-7: Home>Overlay Subtab ........................................................................................... 41
Figure 4-8: Locked Overlay ...................................................................................................... 42
Figure 4-9: Status Screen Example ........................................................................................... 43
Figure 4-10: Scope Indicators .................................................................................................. 44
Figure 4-11: Power Recovery Options........................................................................................ 46
Figure 4-12: Multi-Oven and Schedule Relationship .................................................................... 47
Figure 4-13: Schedule>Queue Display ...................................................................................... 48
Figure 4-14: Schedule>Step display ......................................................................................... 49
Figure 4-15: Schedule>TOD display .......................................................................................... 50
Figure 4-16: Schedule>Demand subtab .................................................................................... 51
Figure 4-17: Analysis>Chart Subtab ......................................................................................... 52
Figure 4-18: Graphic Editor/Tabular Editor Map .......................................................................... 53
Figure 4-19: Analysis>Tabular Editor subtab .............................................................................. 53
Figure 4-20: Select the Normalize Option .................................................................................. 54
Figure 4-21: Normalized Report ............................................................................................... 55
Figure 4-22: Library Stored Analysis ......................................................................................... 58
Figure 4-23: Reprocessing Button ............................................................................................. 59
Figure 4-24: Setup>Config Subtab Example .............................................................................. 60
Figure 4-25: Recovery and Backup Options ................................................................................ 61
Figure 4-26: Error message ..................................................................................................... 62
Figure 4-27: Setup>Components Configuration Display ............................................................... 63
Figure 4-28: Setup>Streams Configuration................................................................................ 64
Figure 4-29: Master Controller configuration .............................................................................. 65
Figure 4-30: Network Setup Example ........................................................................................ 66
Figure 4-31: Saving Configuration Message ............................................................................... 67