48 | PGC5000 GEN 2 | 892 J006 MNAH
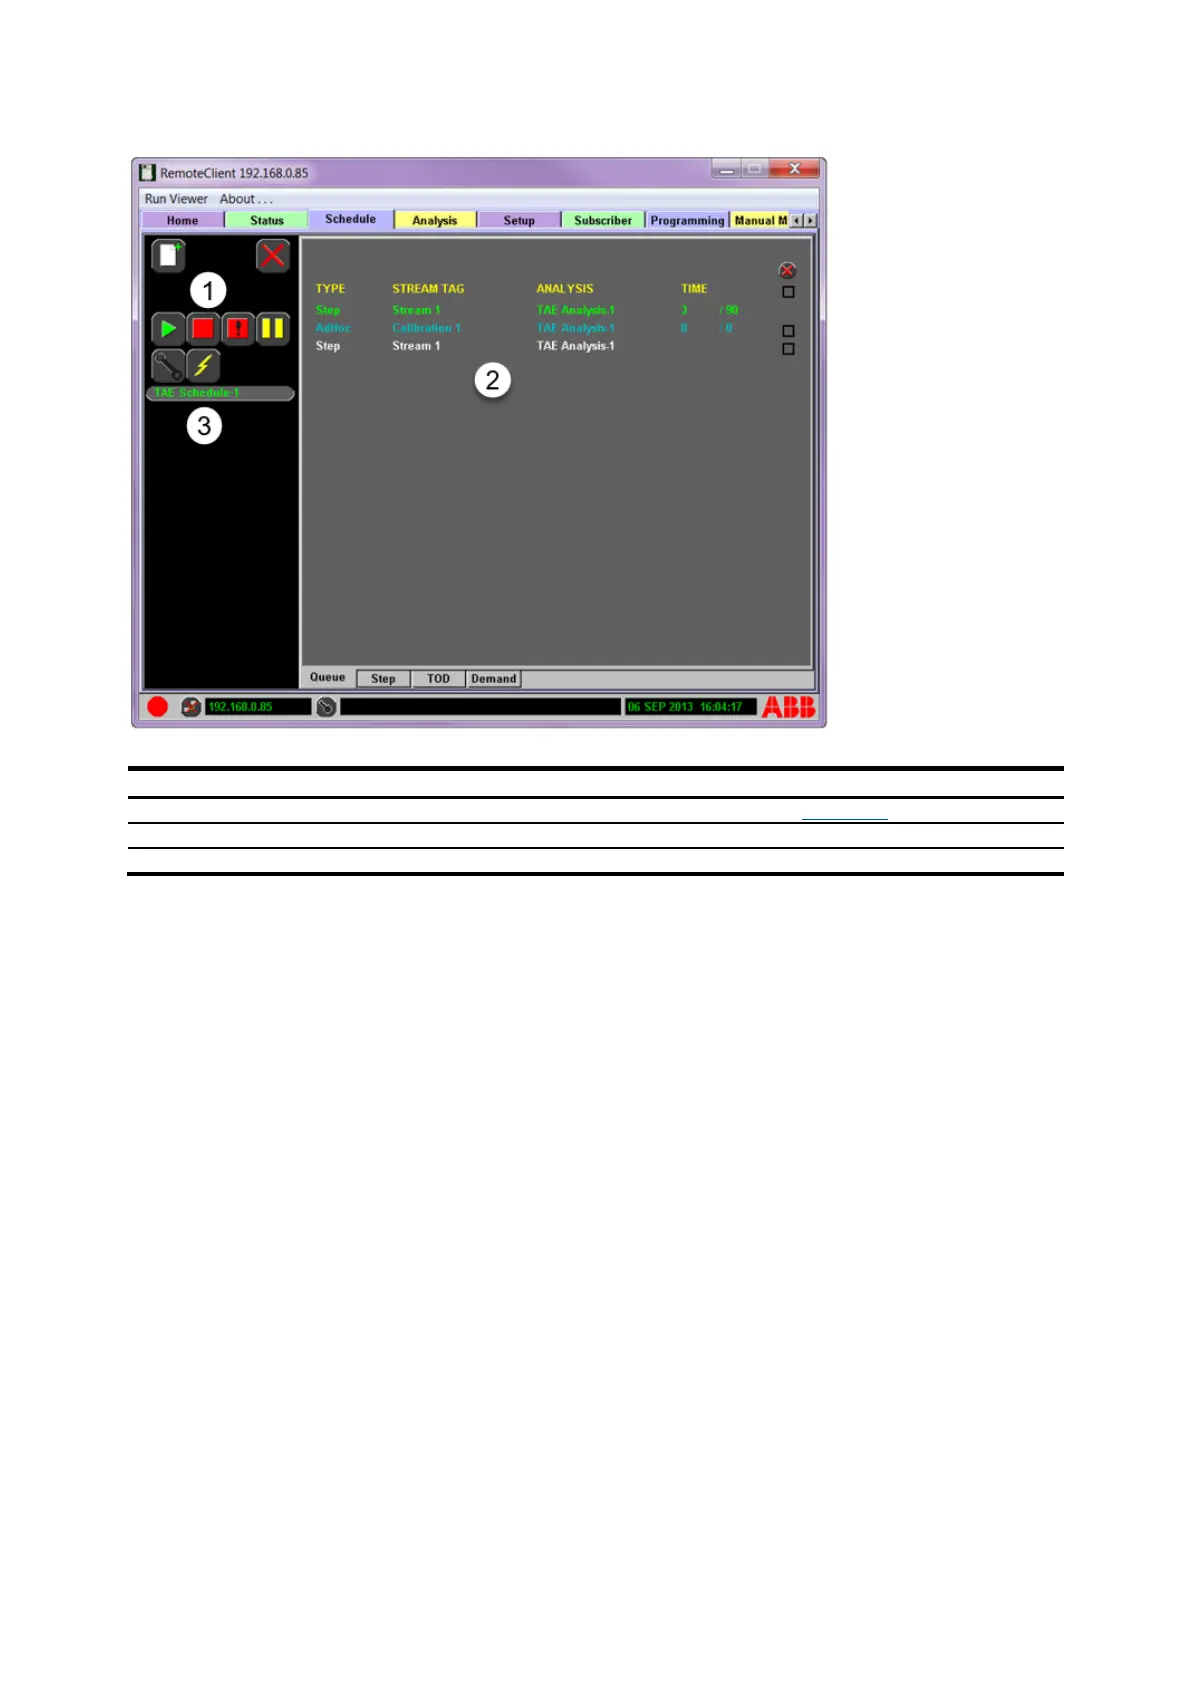
Figure 4-13: Schedule>Queue Display
Legend: Schedule>Queue Display
A green entry represents the current running analysis in the selected schedule. Total analysis time
and time into analysis are displayed under the time heading.
A yellow entry identifies the sample that is purging for the next analysis.
A blue entry identifies the stream which is next to be purged.
A white entry identifies any additional Time of Day (TOD) or Demand request in the order of analysis.
The type of stream analysis displayed is defined as follows:
⎯ Step: The sequence of stream analyses defined on the Step subtab
⎯ Time of Day (TOD): Scheduled stream analyses defined on the TOD subtab
⎯ Demand (Ad Hoc): Demand stream analysis requests
Any stream analysis which is blue or white can be deleted from the queue using the selection box and
delete button on the right side of the screen.
When a schedule goes offline, the associated schedule button behaves as follows:
⎯ Stopped schedules blink letters white and red; when the schedule comes online, the button
letters turn red.
⎯ Running schedules blink letters white and green; when the schedule comes online, the button
letters turn green.
⎯ Paused schedules blink letters white and yellow; when the schedule comes online, the button
letters turn yellow.