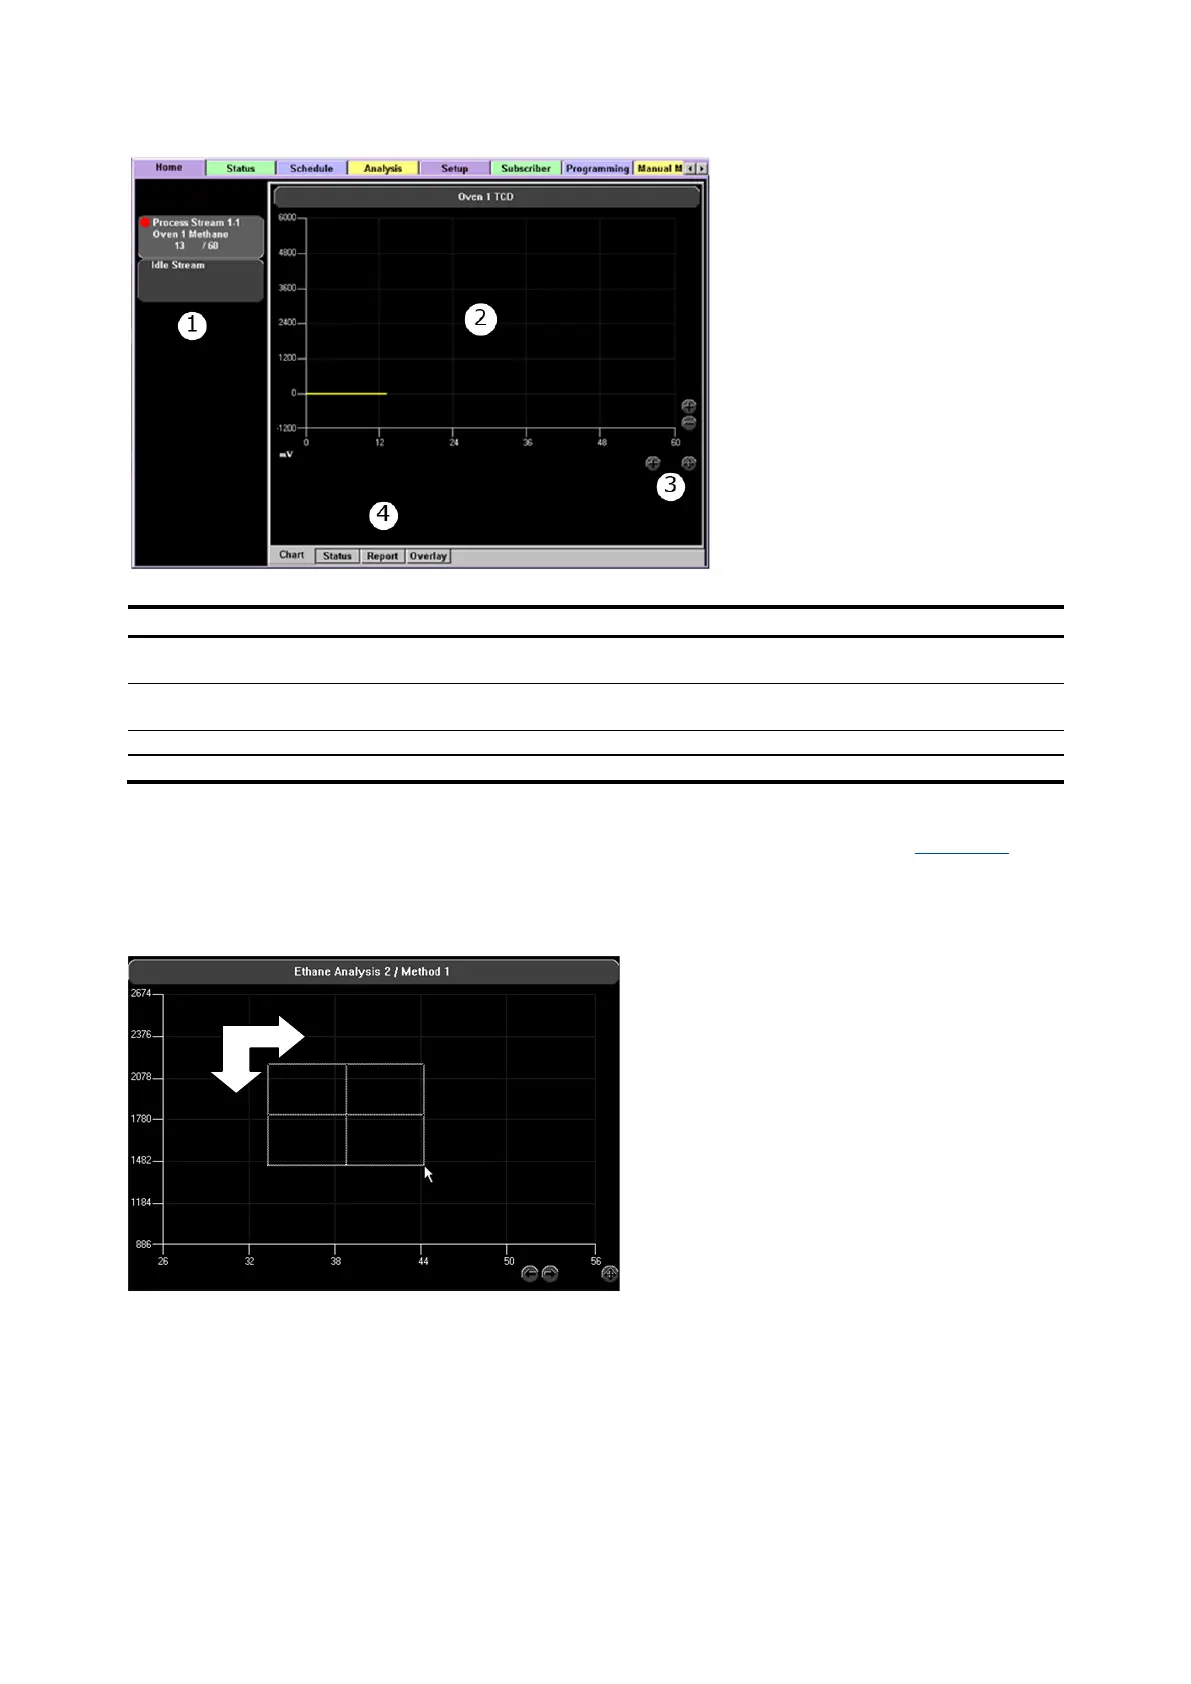
Analysis Buttons – Displays the indicator level and analysis progress for all active analyses. The
Idle Stream is included for review of chromatograms or reports not currently running.
Selecting the chart controls allows zooming or panning of the current chromatogram.
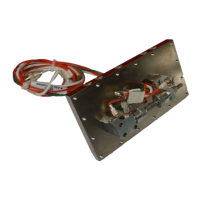
To zoom an area, use the cursor to select a point on the chart as a starting point (see Figure 4-2).
Hold the mouse button down and drag the box over the desired viewing area. Release the mouse
button to complete the zoom. To return to the default view, select the crossed arrow button in the
lower right corner of the screen.
Figure 4-2: Zooming an Area
To zoom an area on the touchscreen at the LUI, use your finger (or other type of touchpad stylus) and
touch the screen at the starting point of where you want to have your zooming window begin. Keep
your finger/stylus pressed gently on the screen and drag the zooming box over the desired viewing
area. Release your finger/stylus from the touchscreen to complete the zoom. To return to default
view, select the crossed arrow button.