MODULE 6: CALIBRATION
6-22 AEROSET
®
Customer Training Guide
94858-103 — July 2003
NOTE: When “*******” is displayed in the Factor/Slope field,
the number of decimal places configured must be reduced to
allow the System to display the actual factor/slope. The
maximum number of digits that can be displayed in this field is 7
(including the negative sign and decimal point).
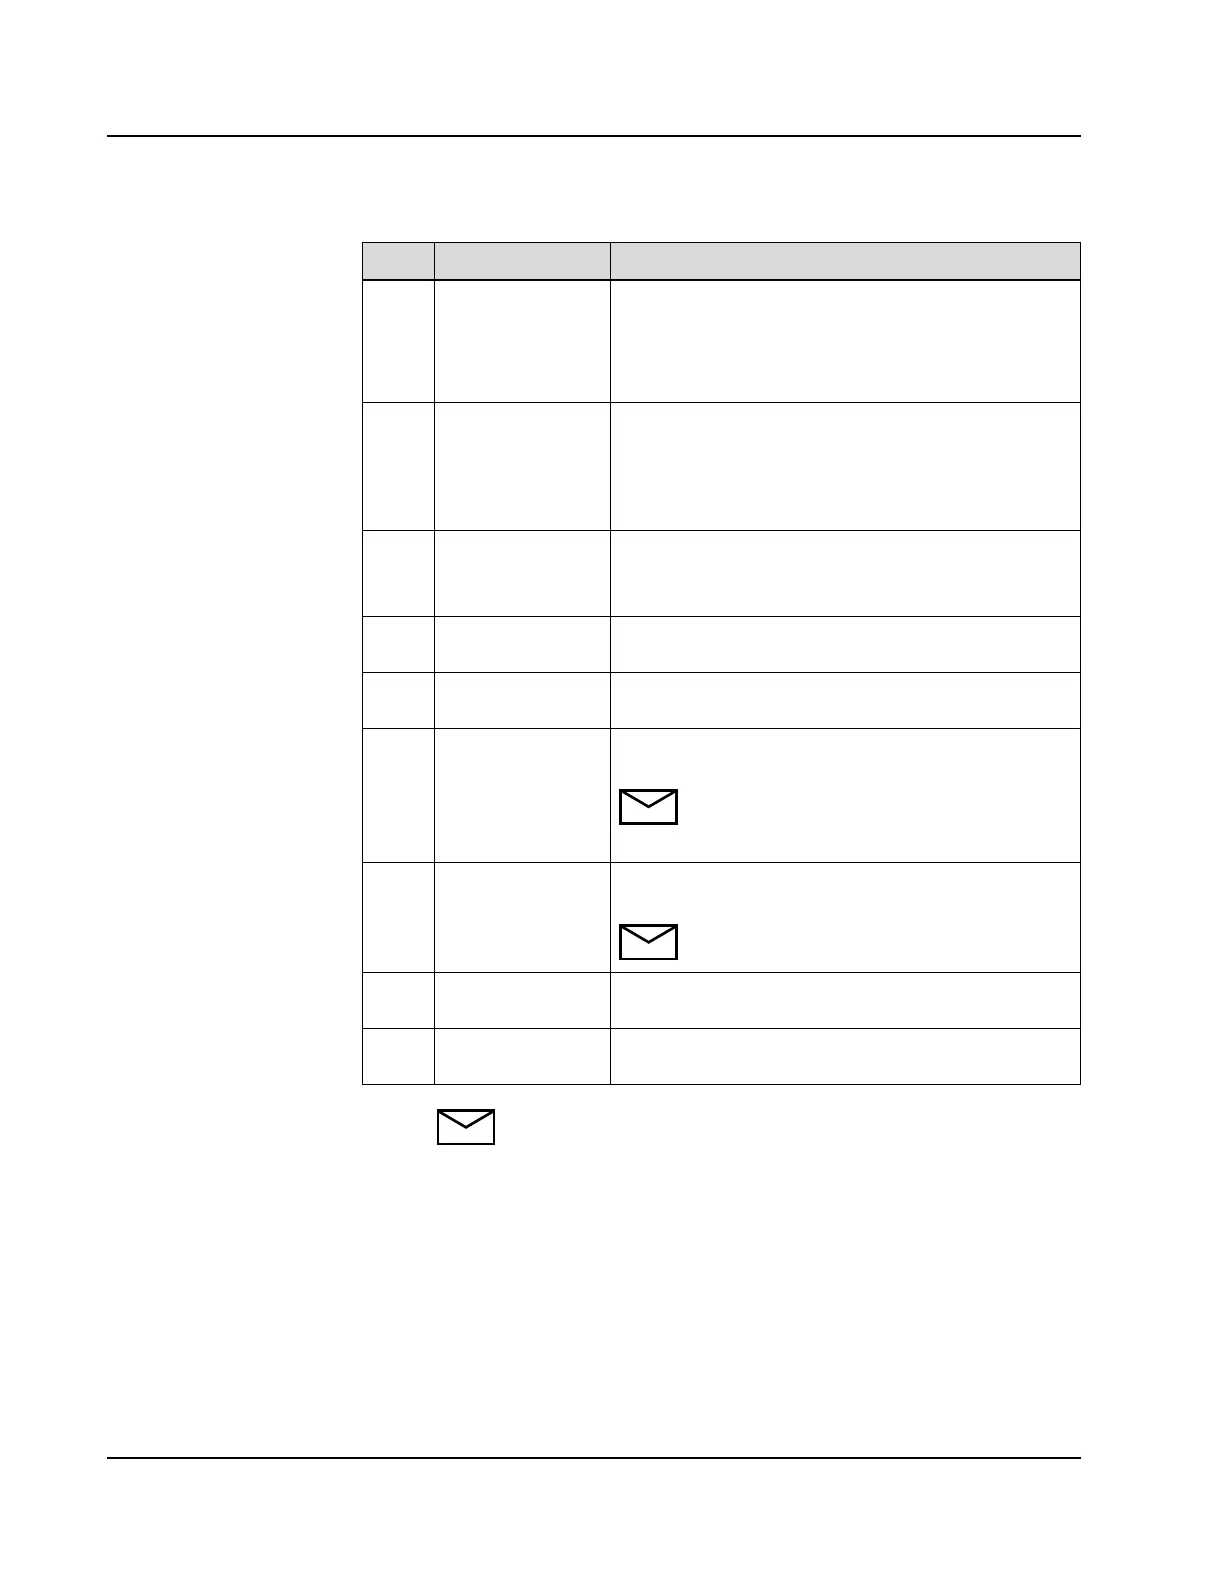
Area Text/Field Description
1 Graph Displays the actual calibration curve.
Blue = Current
Gray = Previous
Pink = Stored
2 Abs This column displays the measured absorbance (or
absorbance change) of the blank and the calibrators. The
absorbance values displayed are the median or mean
values of the calibrator replicates and have been
corrected by the blank value.
3 Factor This column displays the calculated factor for each
section of the curve.
Factor = 1 ÷ Slope
4 Conc This column displays the calibrator concentration
configured in the CALIBRATOR/CONTROL screen.
5 Calibration Error
Code
This area displays any Calibration Error Codes
associated with the displayed calibration curve.
6 Calibration
Expiration
This area displays the date and time that the calibration
expires.
NOTE: The text “Automatic Calibration”
displays next to this field when an automatic
calibration is scheduled.
7 Calibration Date This area displays the date and time that the calibration
was performed.
NOTE: This date and time is only updated when
a full calibration is performed.
8 Scroll Buttons These buttons scroll between the current, previous, and
stored calibration curves.
9 CUR This button is selected to view the current calibration
curve.