MODULE 7: QUALITY CONTROL
7-14 AEROSET
®
Customer Training Guide
94858-103 — July 2003
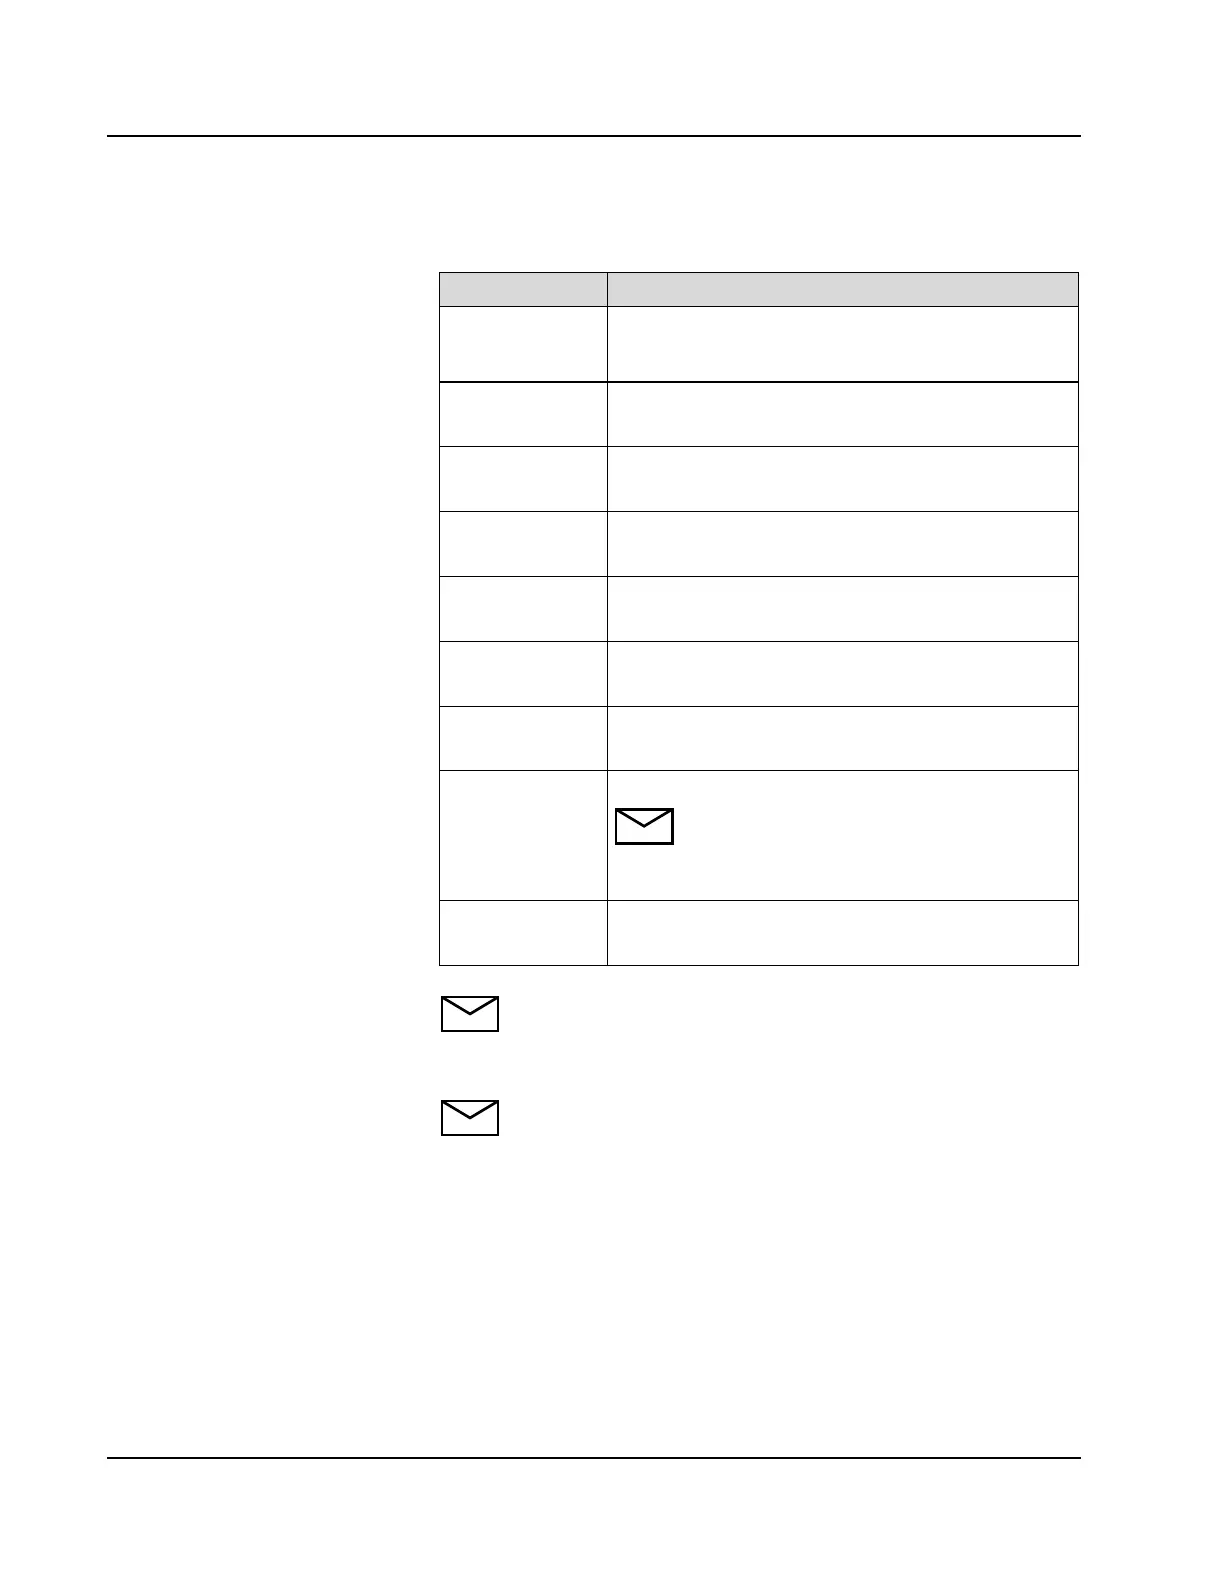
The following table defines each column of the QC information:
NOTE: The mean, SD, CV, range, and N are calculated using all
data points except those excluded in the Levey-Jennings Details
screen.
NOTE: For a QC result to be flagged with an “L” or “H” Result
Flag, the mean concentration and SD must be considered. A
result is rounded to the reporting number of decimals for an
assay after comparing the result to the QC range.
Column Description
QC
The QC level (QC1 - QC8) defined in the Assay
Configuration screen, QC page and the QC name as
defined in the CALIBRATOR/CONTROL screen
Conc
The expected concentration defined in the
CALIBRATOR/CONTROL screen
Mean
The actual mean of the QC data
SD
The actual standard deviation of the QC data
CV
The actual coefficient of variation of the QC data
Range
The actual range (Max value - Min value) of the QC data
N
The number of QC data points for the level (Max = 450)
Last
The value of the last QC sample run for the level.
NOTE: An “L” or “H” Flag is displayed next to
the result if the value is outside the defined 2 SD
range, and a Result Error Code is displayed if an
error occurred for the result.
QC Rule
Any Westgard Rule violation is displayed in this column;
the highest priority rule displays.