Reviewing QC Results
AEROSET
®
Customer Training Guide 7-15
94858-103 — July 2003
Levey-Jennings Graph
To display the Levey-Jennings Graph screen, select the QC button in
the right-hand column of the ASSAY STATUS screen.
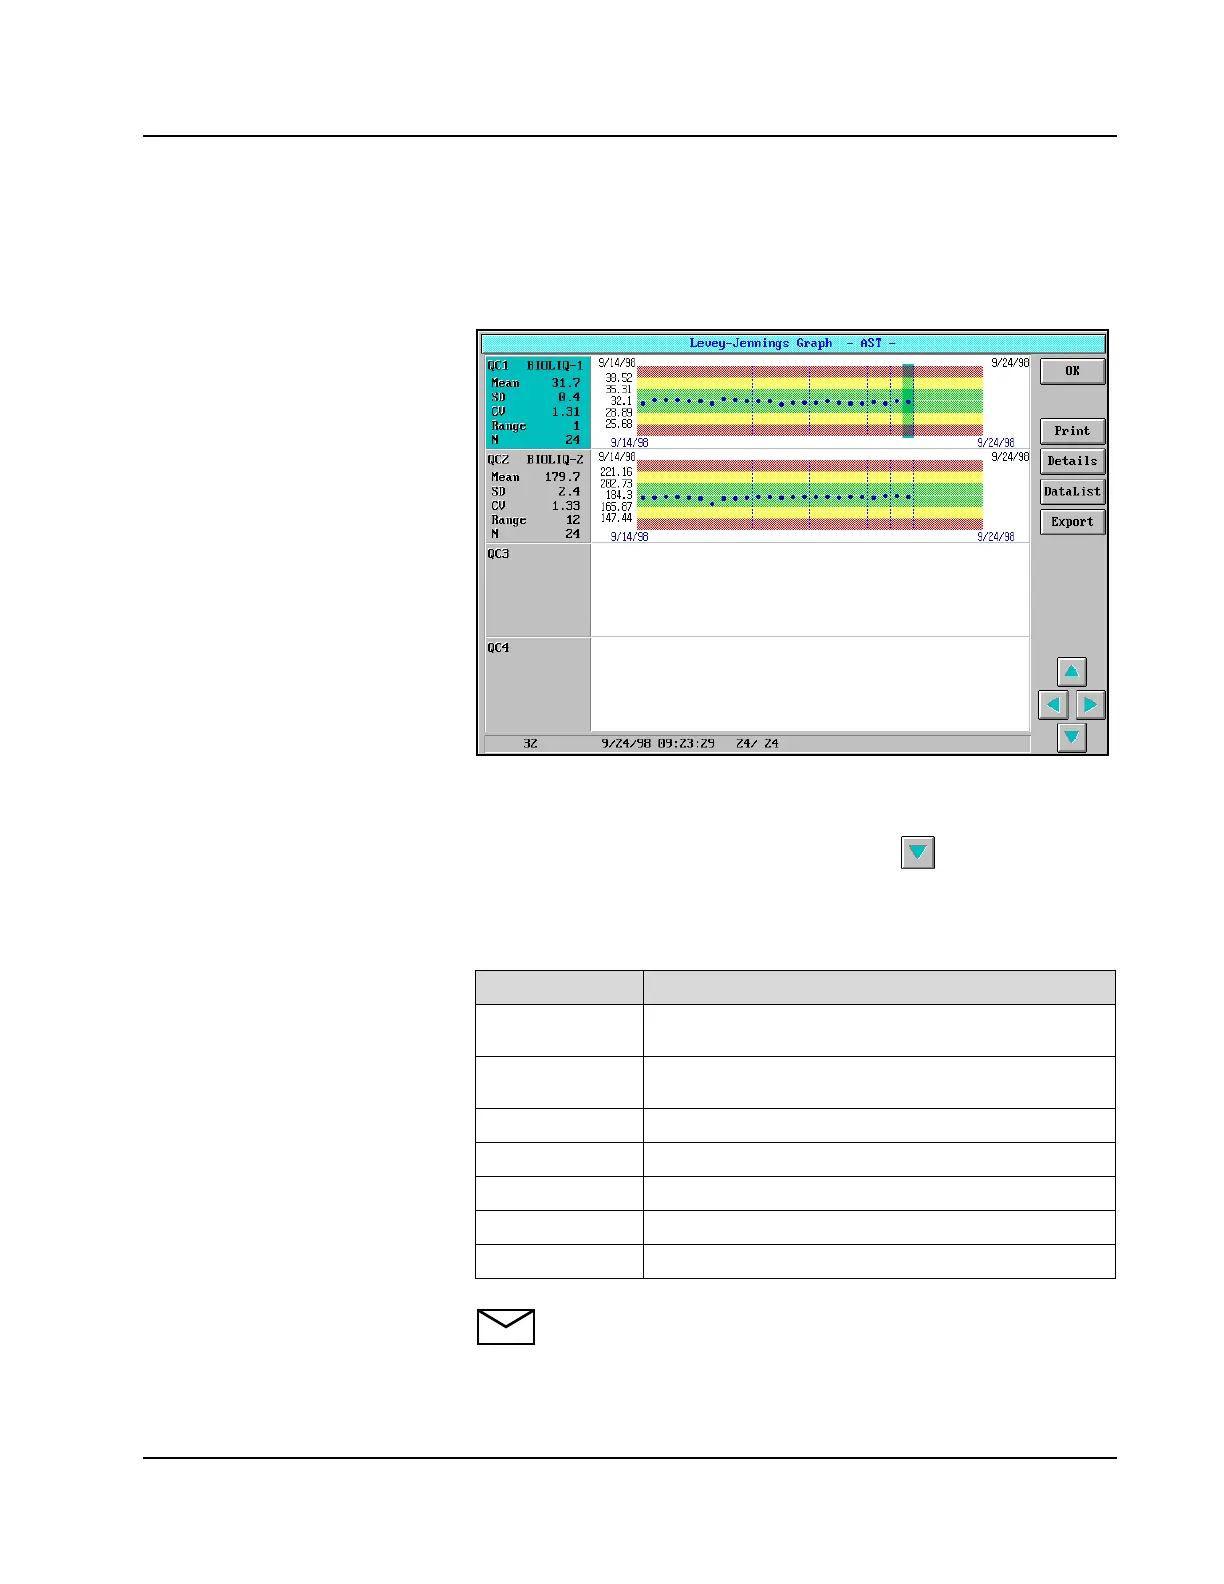
Figure 7.6: Levey-Jennings Graph Screen
The statistics and graphs are displayed for the first 4 QC levels defined.
To view data for additional control levels select on the screen.
Statistics for all QC values included in the QC files are displayed in the
left-hand section for each level (up to 450 values). The following table
describes the information displayed in the left-hand section:
NOTE: The mean, SD, CV, range, and N are calculated using all
data points except those excluded in the Levey-Jennings Details
screen.
Item Description
QC1...QC8
The level defined on the QC page of the Assay
Configuration screen
(QC Name)
The QC name defined in the CALIBRATOR/
CONTROL screen
Mean
The actual mean of the QC data
SD
The actual standard deviation of the QC data
CV
The actual coefficient of variation of the QC data
Range
The actual range (Max value - Min value) of the QC data
N
The number of QC data points for the level (Max = 450)