MODULE 7: QUALITY CONTROL
7-16 AEROSET
®
Customer Training Guide
94858-103 — July 2003
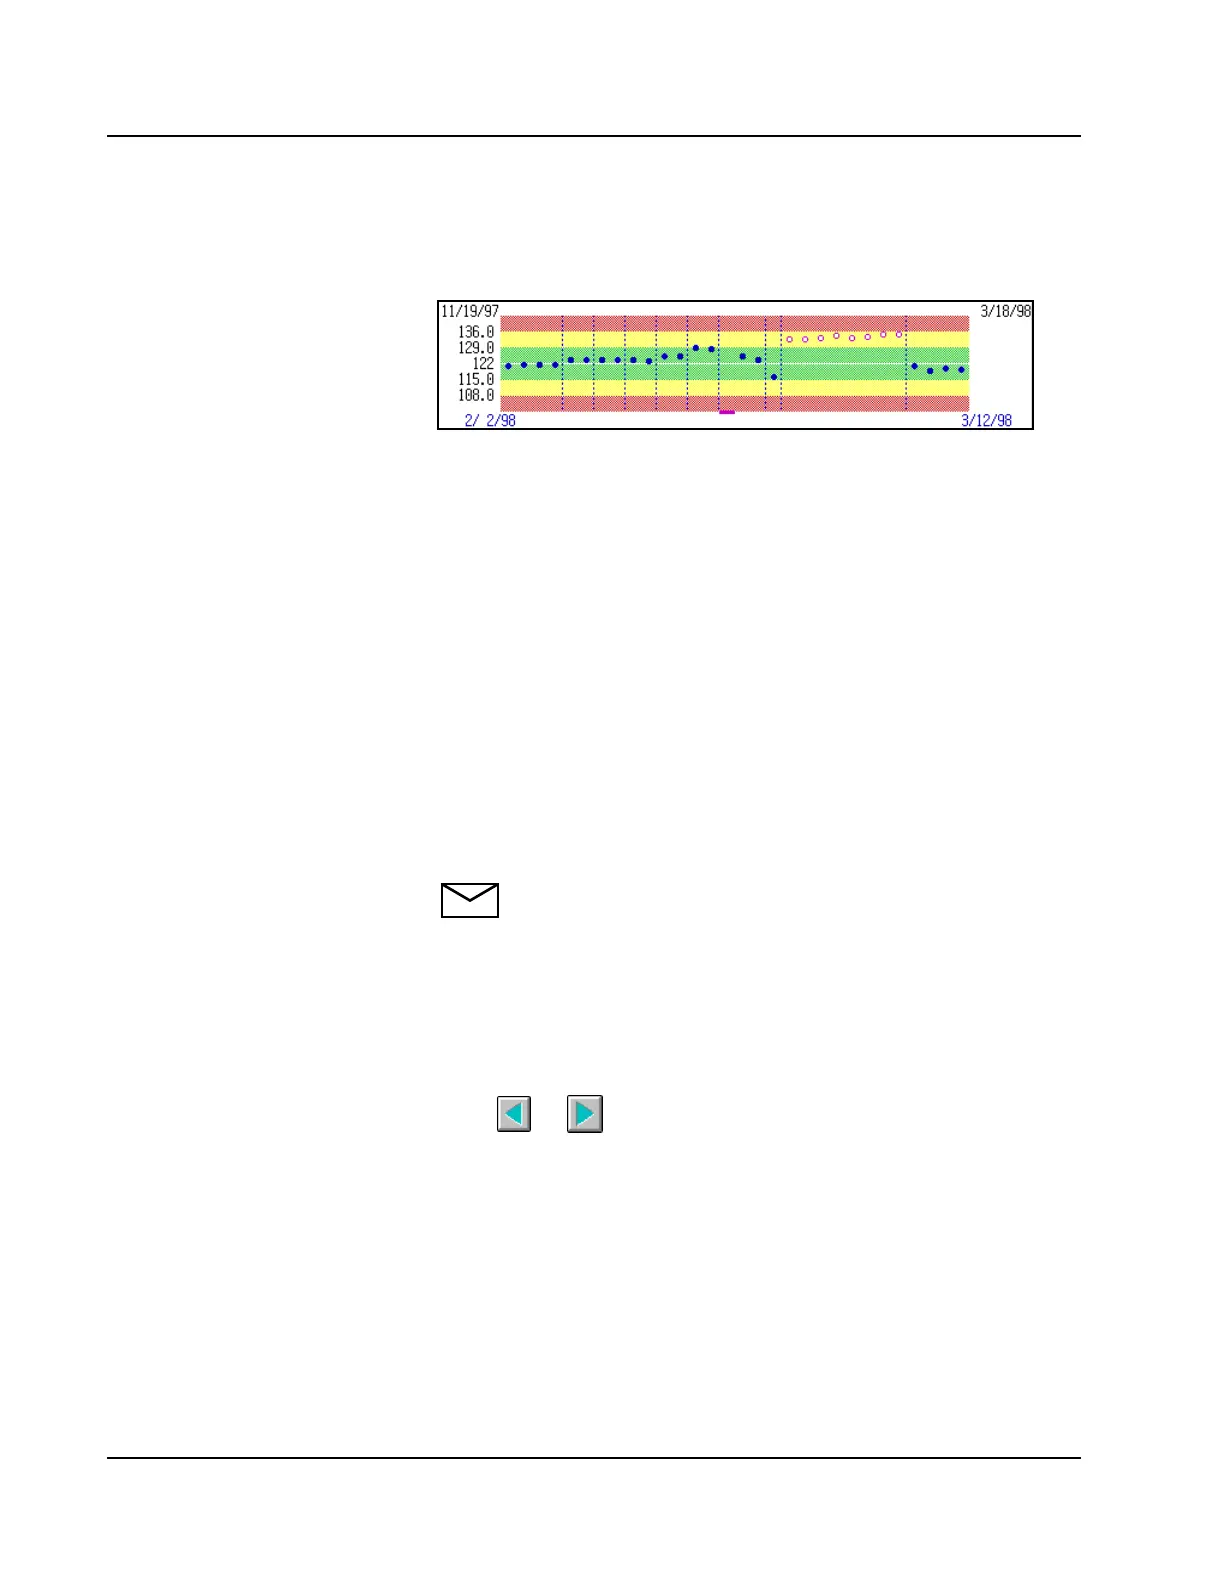
A Levey-Jennings Graph is displayed for each level in the center
section of the screen.
On the left-hand side of the graph the mean, +1 SD, +2 SD,
-1 SD, and -2 SD values are displayed. The mean value is defined in the
CALIBRATOR/CONTROL screen. The SD value is defined on the
QC page of the Assay Configuration screen.
The graph area displays the ±1 SD range in green, the ±2 SD range in
yellow and the ±3 SD range in red. Each accepted QC value within the
±3 SD range is displayed as a blue or gray dot on the graph. If the value
is greater than ±3 SD, it is displayed as a blue or gray bar at the top or
bottom of the graph. Excluded values greater than ±3 SD display as pink
bars at the top or bottom of the graph. The vertical dotted lines indicate
separate days.
Values can be excluded from the calculation of the statistics. If a value is
excluded, the displayed dot is white with a pink outline. If the excluded
value is greater than ±3 SD, the displayed bar is pink.
NOTE: The procedure for excluding QC values is described in
the next subsection.
The dates displayed on the top left and right of the graph are the
completion dates of the first and last QC values in the file (up to 450).
The dates displayed on the bottom left and right of the graph area are the
completion dates of the first and last QC values currently displayed in the
graph (up to 31 points). To display a different date range of the graph
select or on the screen to scroll left or right.