Reviewing QC Results
AEROSET
®
Customer Training Guide 7-17
94858-103 — July 2003
Levey-Jennings Details
To display information about a point on the Levey-Jennings Graph,
perform the following steps:
1. Select the Levey-Jennings Graph for the QC level to be viewed by
selecting the area of the screen where the graph displays. The left-
hand section of the selected level is colored blue, and a point on the
graph is also highlighted in blue.
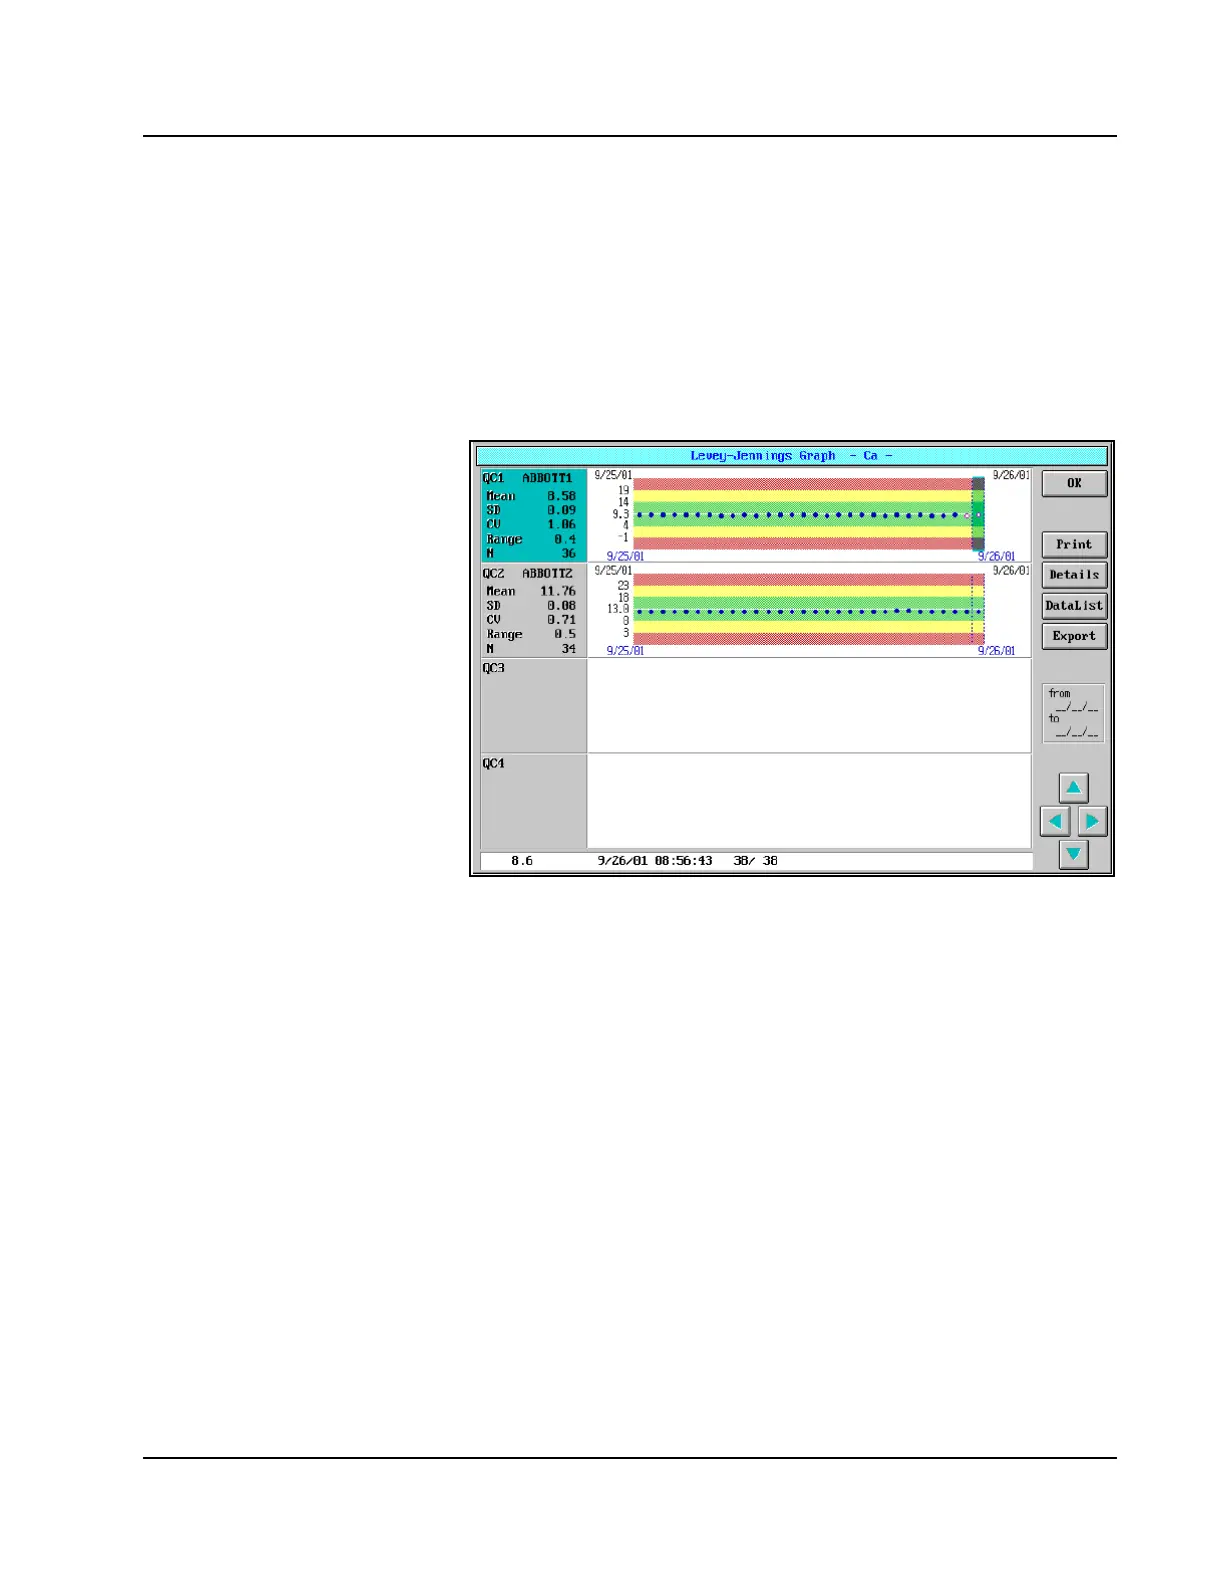
Figure 7.7: Levey-Jennings Graph Screen
2. The following information for the highlighted point is displayed at
the bottom of the Levey-Jennings Graph screen:
• Result value (an “L” or “H” Flag is displayed next to the
result if the value is outside the defined 2 SD range, and a
Result Error Code is displayed if an error occurred for the
result)
• Date and time completed
• Result #/total # of QC values for the level
To view information about another point on the graph, select the point by
touching it or press the left arrow and right arrow keys on the keyboard
to scroll left and right.