MODULE 7: QUALITY CONTROL
7-18 AEROSET
®
Customer Training Guide
94858-103 — July 2003
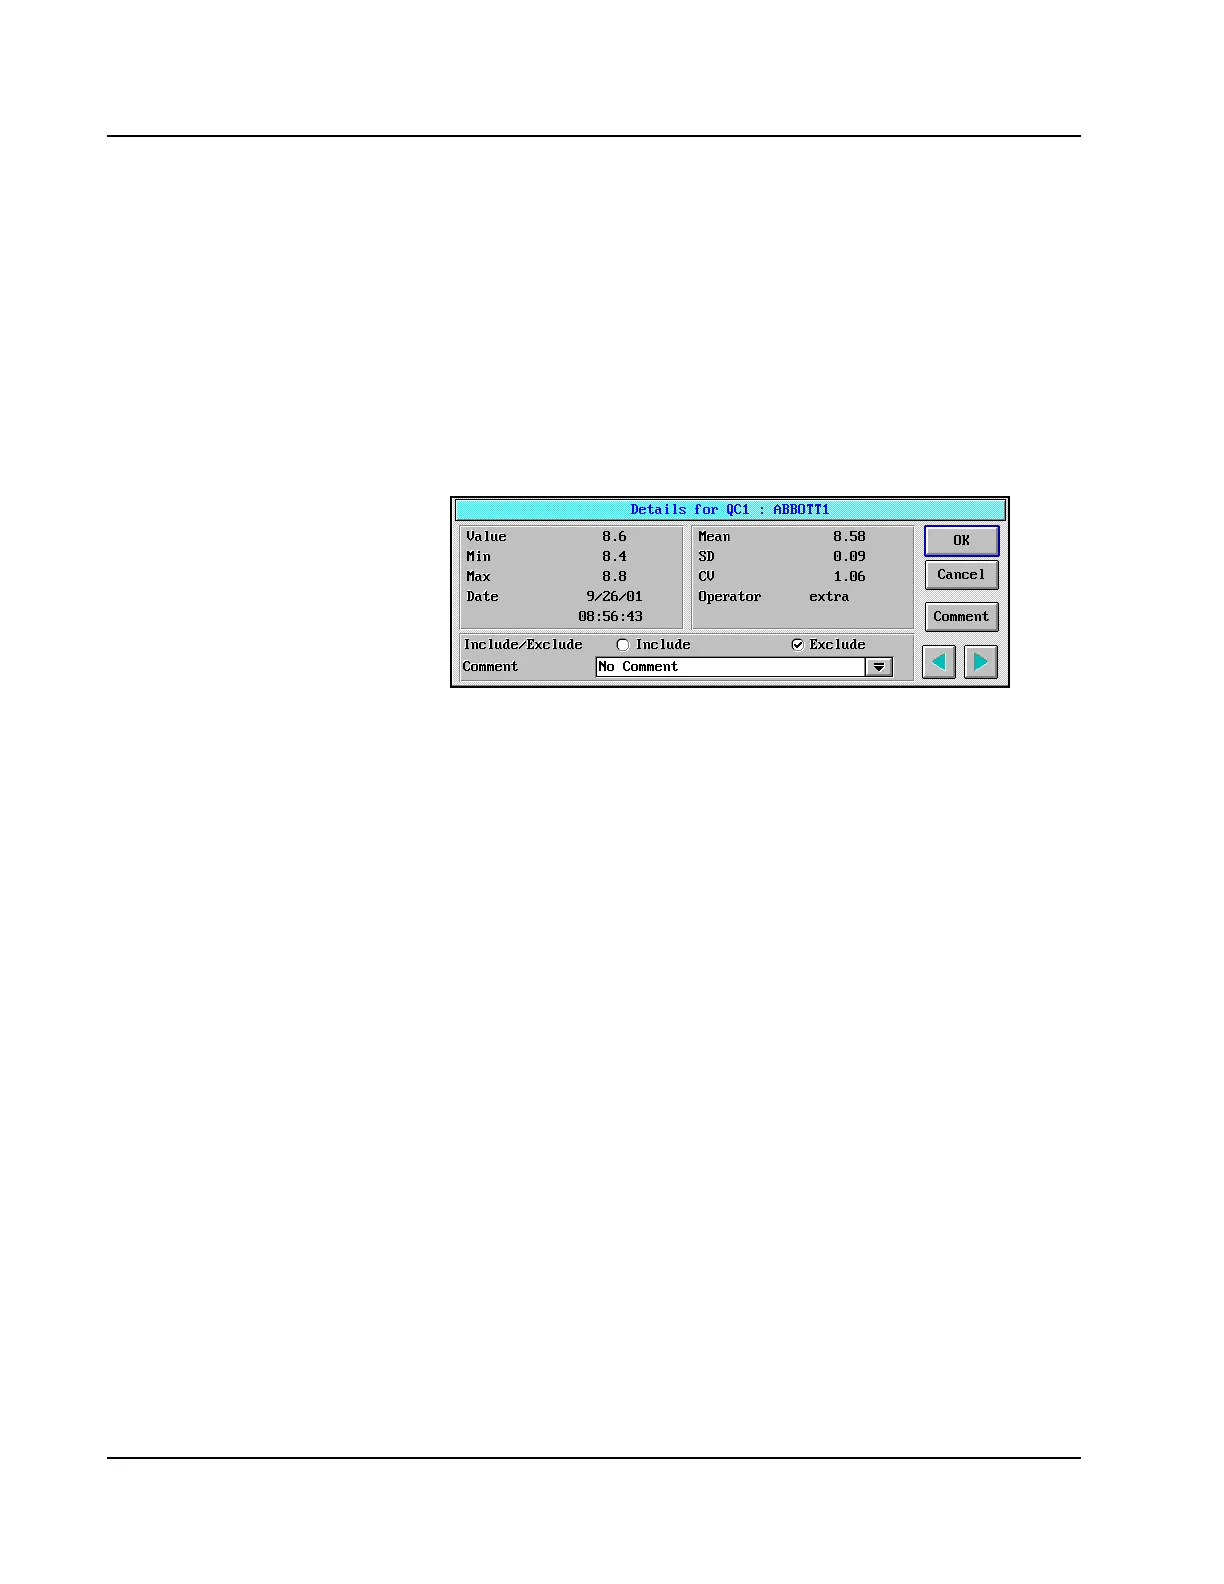
The result value of a point on the Levey-Jennings Graph can be
displayed on the Details dialog window. Also, on the Details dialog
window, a result can be excluded from the calculation of the QC
statistics. To display the Details dialog window for a point, perform the
following steps:
1. Select the point for which details are desired.
2. Select <Details> on the right-hand side of the
Levey-Jennings Graph screen. The Details dialog window is
displayed.
Figure 7.8: Details Dialog Window
• Details let you exclude a point—will
not actually delete the value.
• A specified date range can be selected
to calculate and print QC Statistics for
QC Summary, Levey-Jennings Graph,
and QC Data List reports. The date
range is selected on the QC Summary
screen.