MODULE 7: QUALITY CONTROL
7-22 AEROSET
®
Customer Training Guide
94858-103 — July 2003
QC Data List
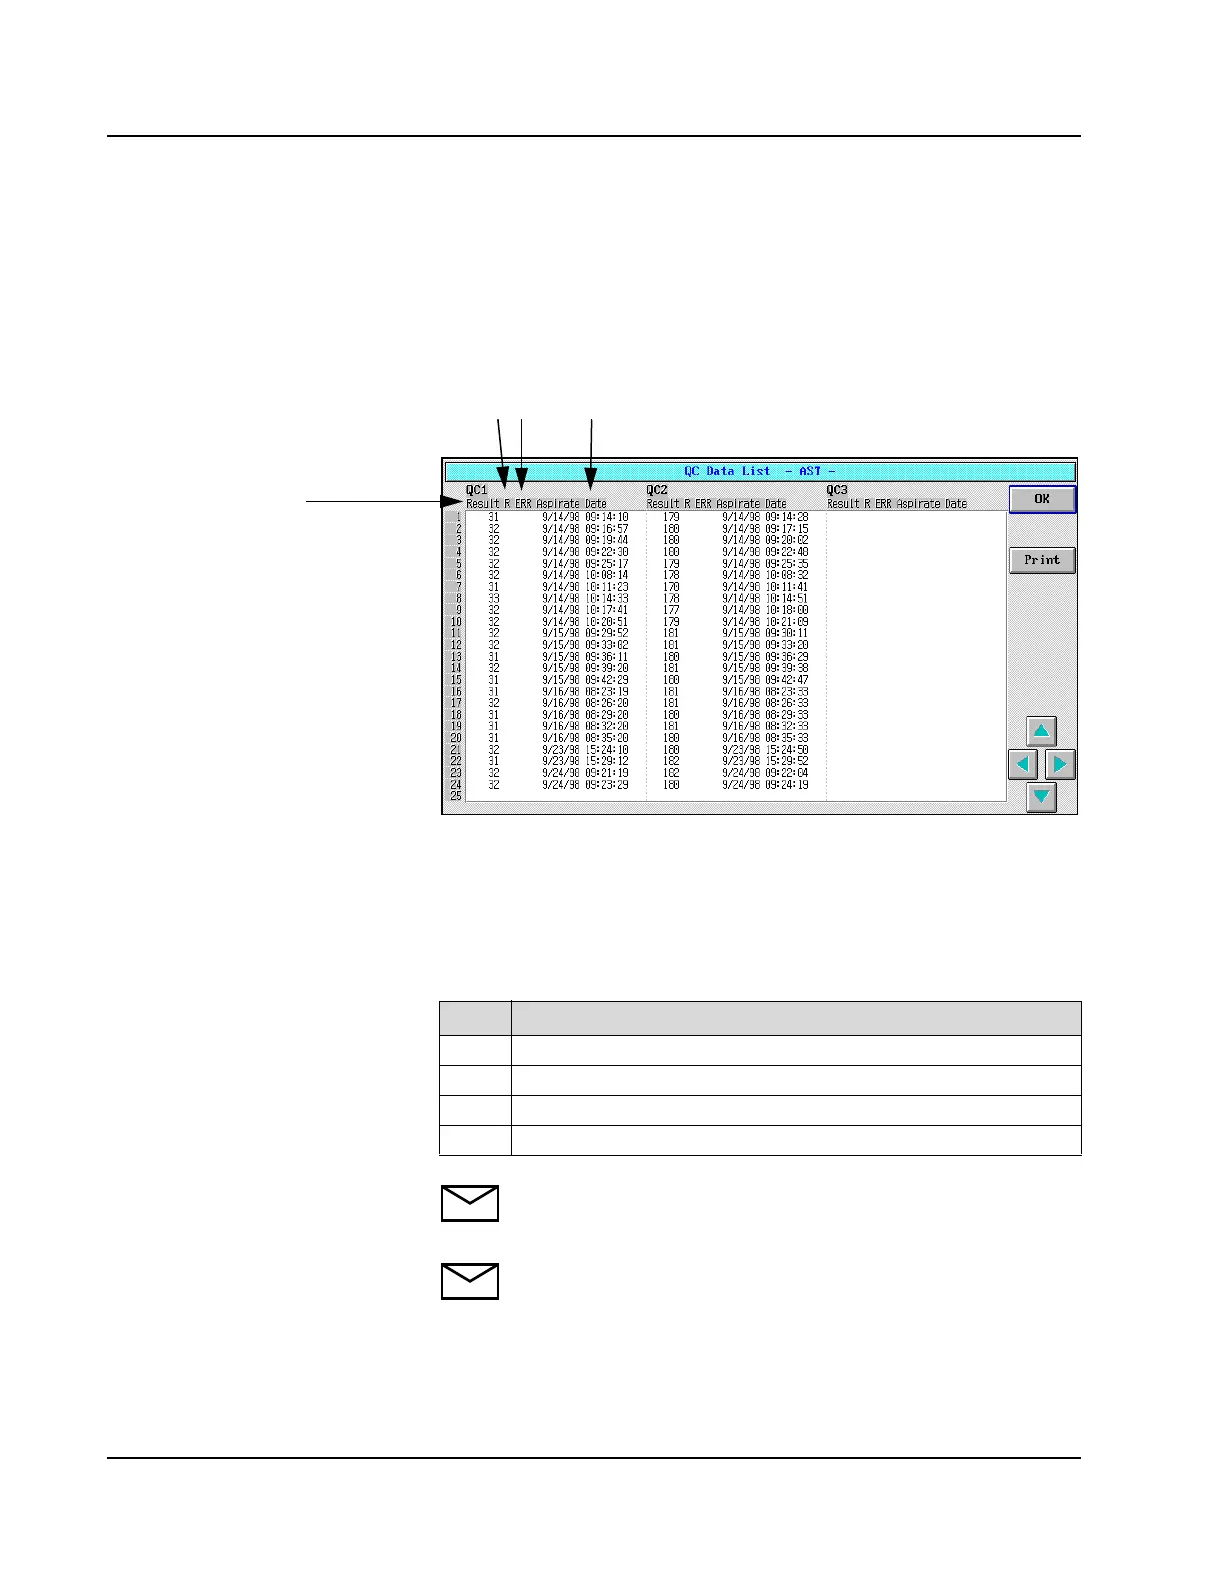
The QC data for an assay are displayed in a list format on the QC Data
List screen. To display the QC Data List screen, select <DataList> on
the right-hand side of the Levey-Jennings Graph screen. The QC Data
List screen displays.
Figure 7.12: QC Data List Screen
All the QC values for the first 3 QC levels display. To view additional
QC values for the displayed levels or to view additional levels, select the
arrow buttons in the right-hand column of the screen . The following
information displays for each value:
NOTE: Excluded values are displayed with pink text.
NOTE: The mean, SD, and CV are calculated using all data
points except those excluded on the Levey-Jennings Details
screen.
Item Description
1
Result = result value
2
R = “L” or “H” Flag (if the value is outside the defined 2 SD range)
3
ERR = Result Error Code (if an error occurred for the result)
4
Aspirate Date = date and time aspirated
1
23 4