MODULE 7: QUALITY CONTROL
7-24 AEROSET
®
Customer Training Guide
94858-103 — July 2003
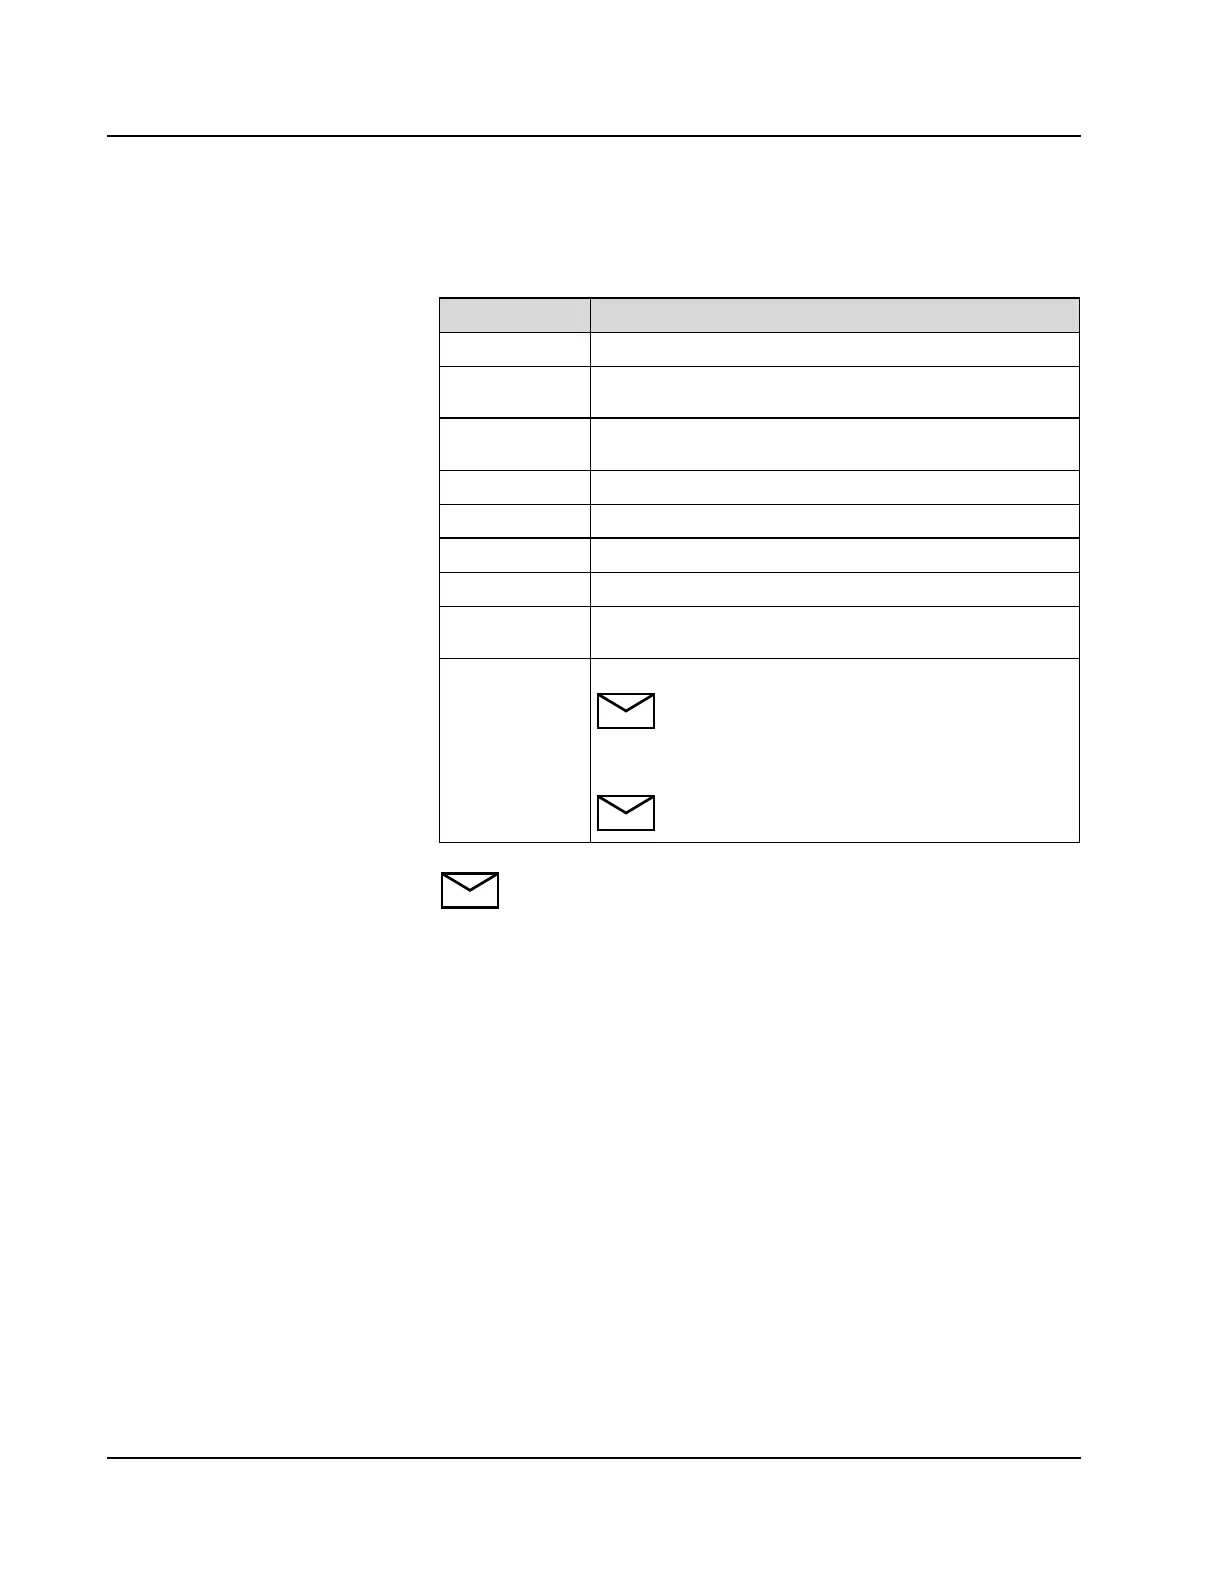
The following information displays for each QC level on the QC
Summary screen.
NOTE: The mean, SD, CV, range, and N are calculated using all
data points except those excluded in the Levey-Jennings Details
screen.
Column Description
Assay
The assay name
QC1...QC8
The name of the QC selected for the level on QC page of
the Assay Configuration screen
Conc
The expected concentration defined in CALIBRATOR/
CONTROL screen
Mean
The actual mean of the QC data
SD
The actual standard deviation of the QC data
CV
The actual coefficient of variation of the QC data
Range
The actual range (Max value - Min value) of the QC data
N
The number of included QC data points for the level (Max
= 450)
Last
The value of the last QC sample run for the level
NOTE: An “L” or “H” Flag is displayed next to
the result if the value is outside the defined 2 SD
range. A Result Error Code is displayed if an error
occurred for the result.
NOTE: If a date range is configured, value is the
last QC sample run in the date range.