MODULE 1: SYSTEM TOUR
1-36 AEROSET
®
Customer Training Guide
94858-103 — July 2003
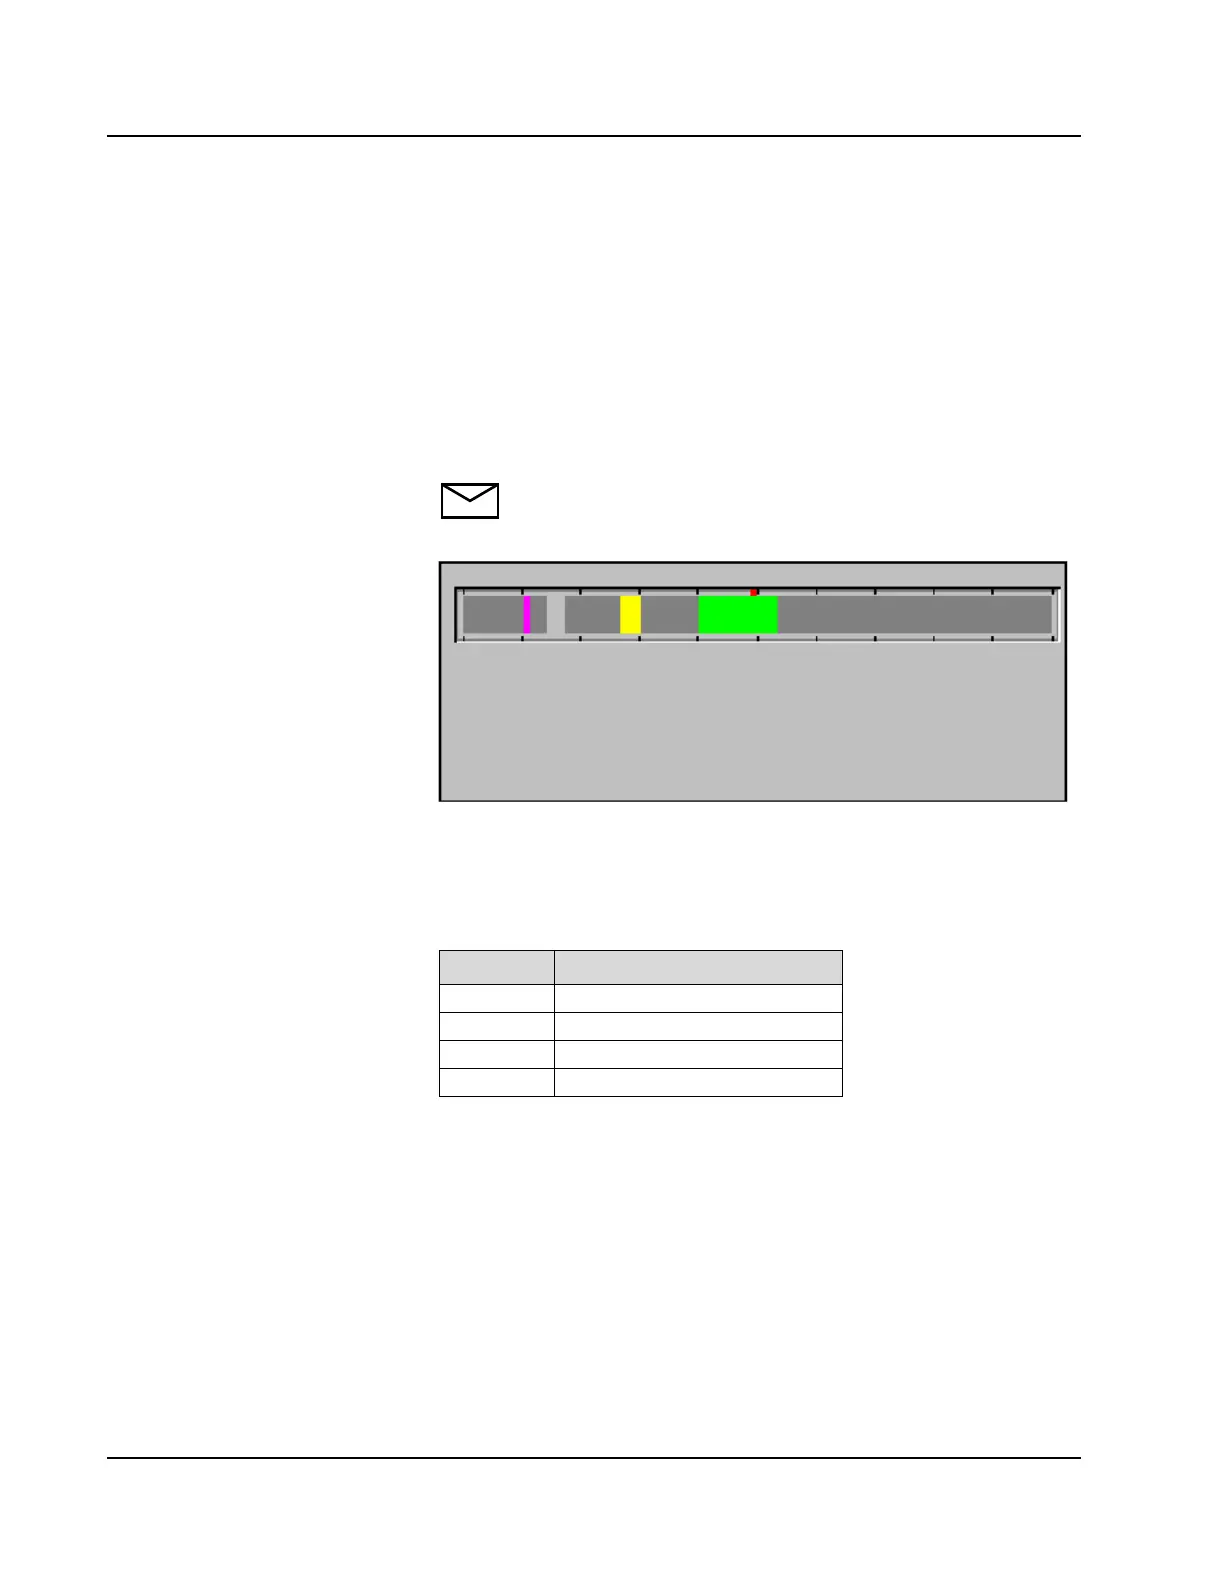
Run Progress Area
This area shows the progress of assay analysis. When measurement is
started, a colored bar appears at the left end of the Run Progress Area,
then moves toward the right as the measurement continues. When the bar
reaches the red mark in the center of the display, the second reagent is
dispensed (where appropriate). When the bar reaches the right end, the
sample is complete and the results are displayed in the DATABASE
screens.
NOTE: The Run Progress Area bar represents approximately 10
minutes of processing time. The black marks divide the bar into
approximately one minute intervals.
Figure 1.22: Run Progress Area of the Main Display
The bar color indicates the type of sample currently being analyzed. The
following table describes the colors that appear.
Color Sample Type
Green Calibrator
Pink STAT Sample
Gray Patient Sample
Yellow Control