ToolsTalk ACTA
162
From the calculations it is clear that the standard deviation of the mean is
smaller than the standard deviation of the variable itself. Therefore individual
observations may fall outside the control limits.
Important
Control limits and Tolerance limits are not the same. Control limits are used in
SPC. Tolerance limits indicate the minimum and maximum permitted values for
a certain application. For a process that is under control, the Control limits are
situated within the Tolerance limits.
Individual observations that fall outside the control limits of an X-bar chart do
not indicate a problem. If mean points fall outside the control limits, corrective
action should be taken.
14.4.3 R charts
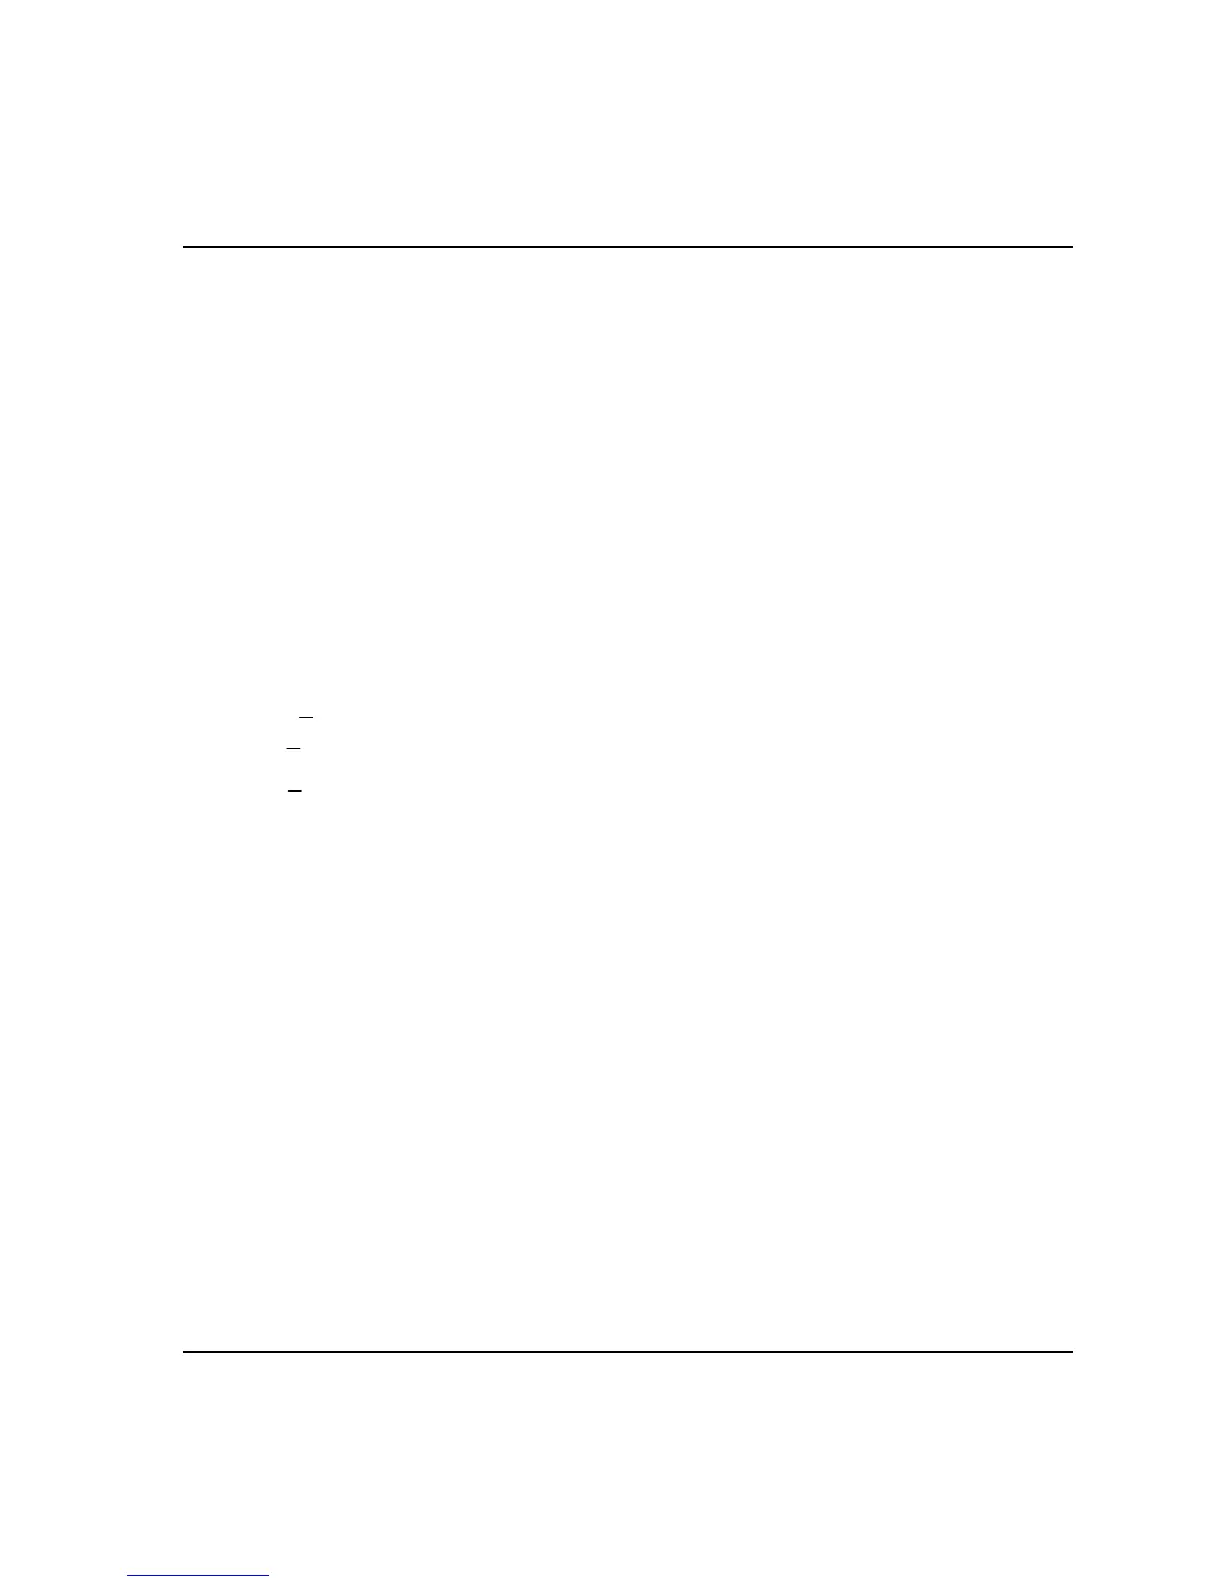
The R chart, Range chart, is used for control of the process variation. The
centre line is
D
4
and D
3
depend on the sample group size, and may be found in manuals of
statistical process control. D
3
, and consequently the lower control limit, is 0 for
sample groups of six or less.
R charts are useful when the process level remains stable, while the variation
changes. Such a change may be difficult to detect in an X-bar chart.
There are numerous ways of establishing the centre line and control limits in
control charts. For more information, please contact your local Atlas Copco
representative.

 Loading...