GAMATRONIC ELECTRONIC INDUSTRIES LTD.
34
4.4 POWER
+
control screen
The POWER
+
control screen is illustrated below. It is part of the control panel described on page 32.
How to read and understand the POWER
+
control screen is described in detail in Chapter 6, POWER
+
control panel, beginning on page 55.
The control screen provides menus and displays all aspects of the POWER
+
systems input, output and
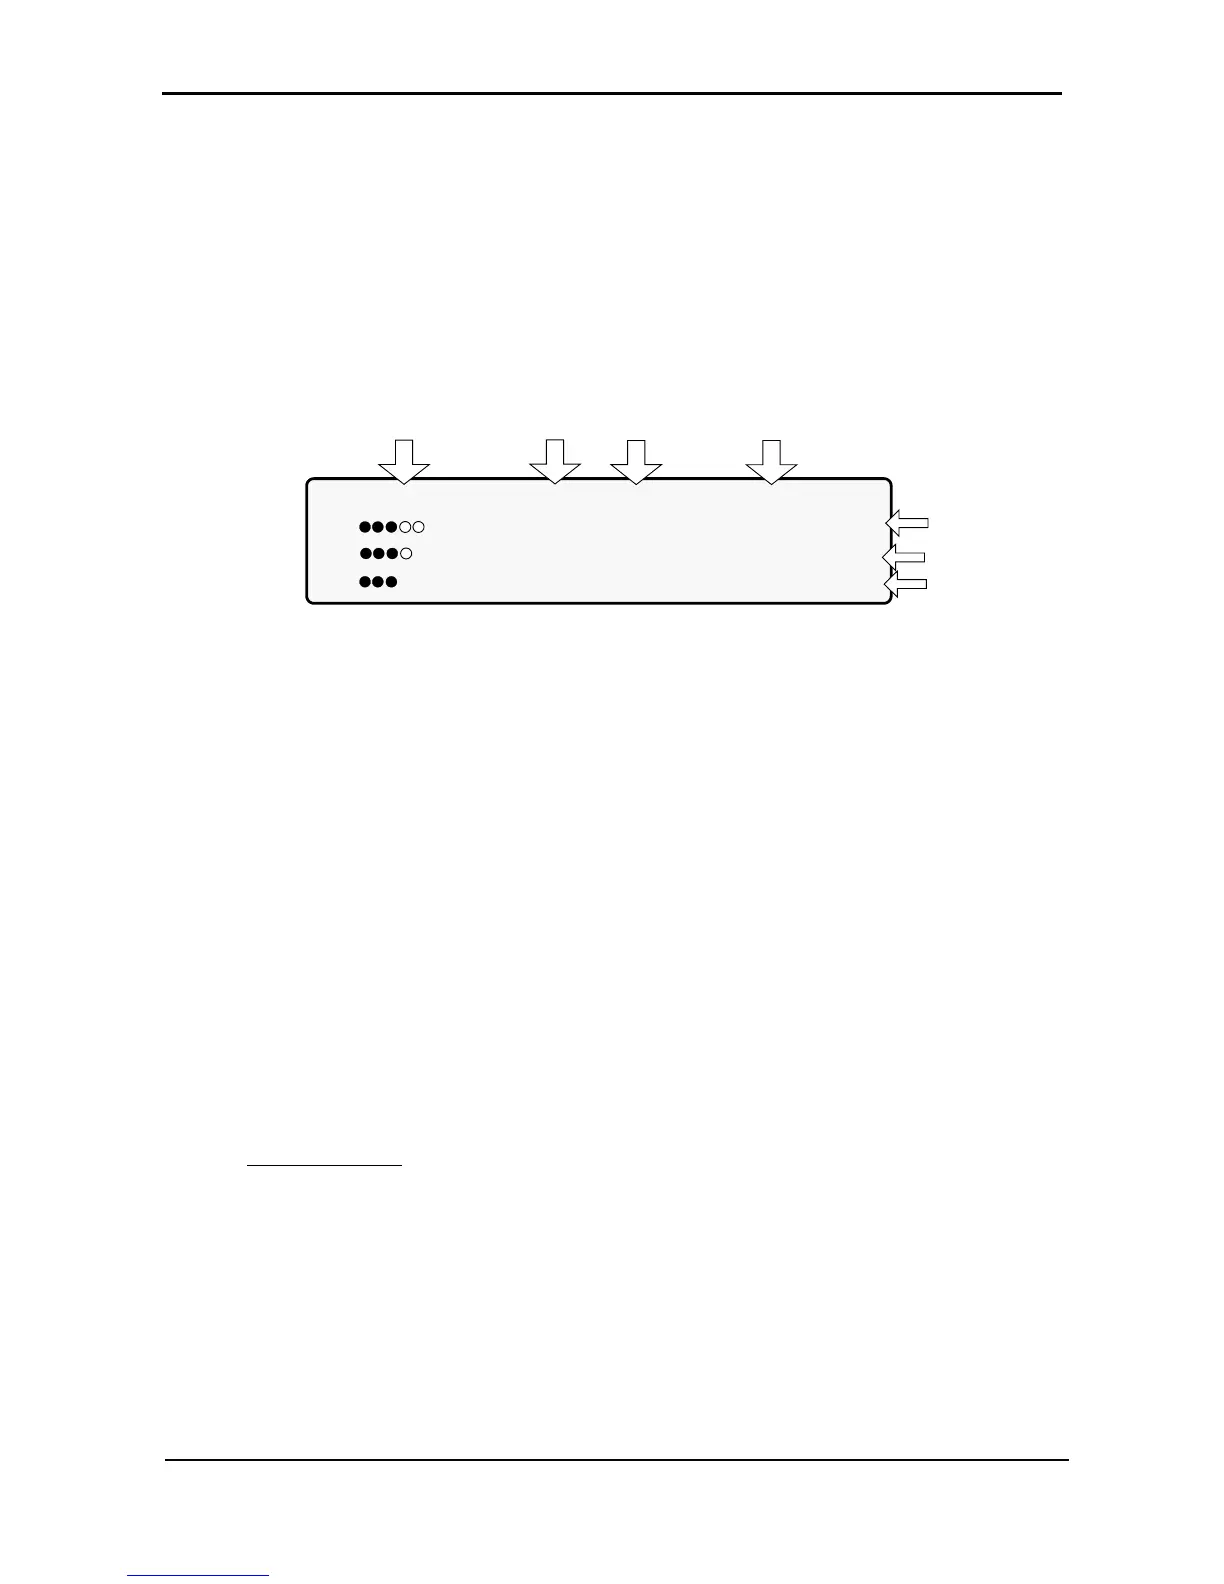
static switch as well as operational details. The figure below shows the POWER
+
3-phase display.
LOAD LEVEL ---11:20:25---
L1: _____ 015A, 230V BATTERY: 864V
L2: ______ 012A, 230V UPS OK (ON)
L3: _______ 011A, 230V STSW OK (INV)
Load level
bar graph
Output
current
Output
voltage
Current
time
Battery
voltage
Status
indications
Figure 28: POWER+ control screen
This is how the control screen appears while the UPS is running normally.
4.4.1 Load-level bar graph
The load-level bar graph on the default screen display illustrates the approximate load on each output
phase of the UPS, as a percent of the maximum available output for each phase.
The load on each phase is represented by a series of from 1 to 10 dots. Each dot represents about 10 % of
the maximum available output per phase.
The dots can be either filled in (black) or clear (white). The number of black dots represents kW, and the
number of black and white dots together represents kVA (apparent power).
For example, in Figure 28, the load on Line 2 is 30 % (3 black dots) of the maximum in terms of kW, and
40 % (3 black dots plus 1 white dot) of the maximum in terms of kVA.
To compute the approximate value in kW or kVA of each dot:
1. Compute the maximum load per phase =
10 kVA [or 8 kW]
3 phases
x (total # of modules - redundant # of modules)
2. Dividing the maximum load per phase by 10 gives you the value of 1 dot.
Example: Assume a system with 10 modules, 2 of which are redundant.
10 kVA / 3 x (10-2) = 3.33 x 8 = maximum load per phase = 26.67 kVA.
Thus, 26.67 / 10 = 2.67 kVA is the approximate value of each dot.