7 Operation
Maschinenfabrik Reinhausen GmbH 2019 1735163667/06 EN ETOS
®
IM
7. Use the mouse to drag a selection window in order to zoom into the dia-
gram. Select the button to reduce the diagram back to its original
size.
8. Select the button to save the displayed measured values as a csv file.
Trend curves
If you call up the measured value recorder using a PC, you can display a
trend curve instead of the measured values. The trend curve can, for exam-
ple, be a moving average over a configurable time period.
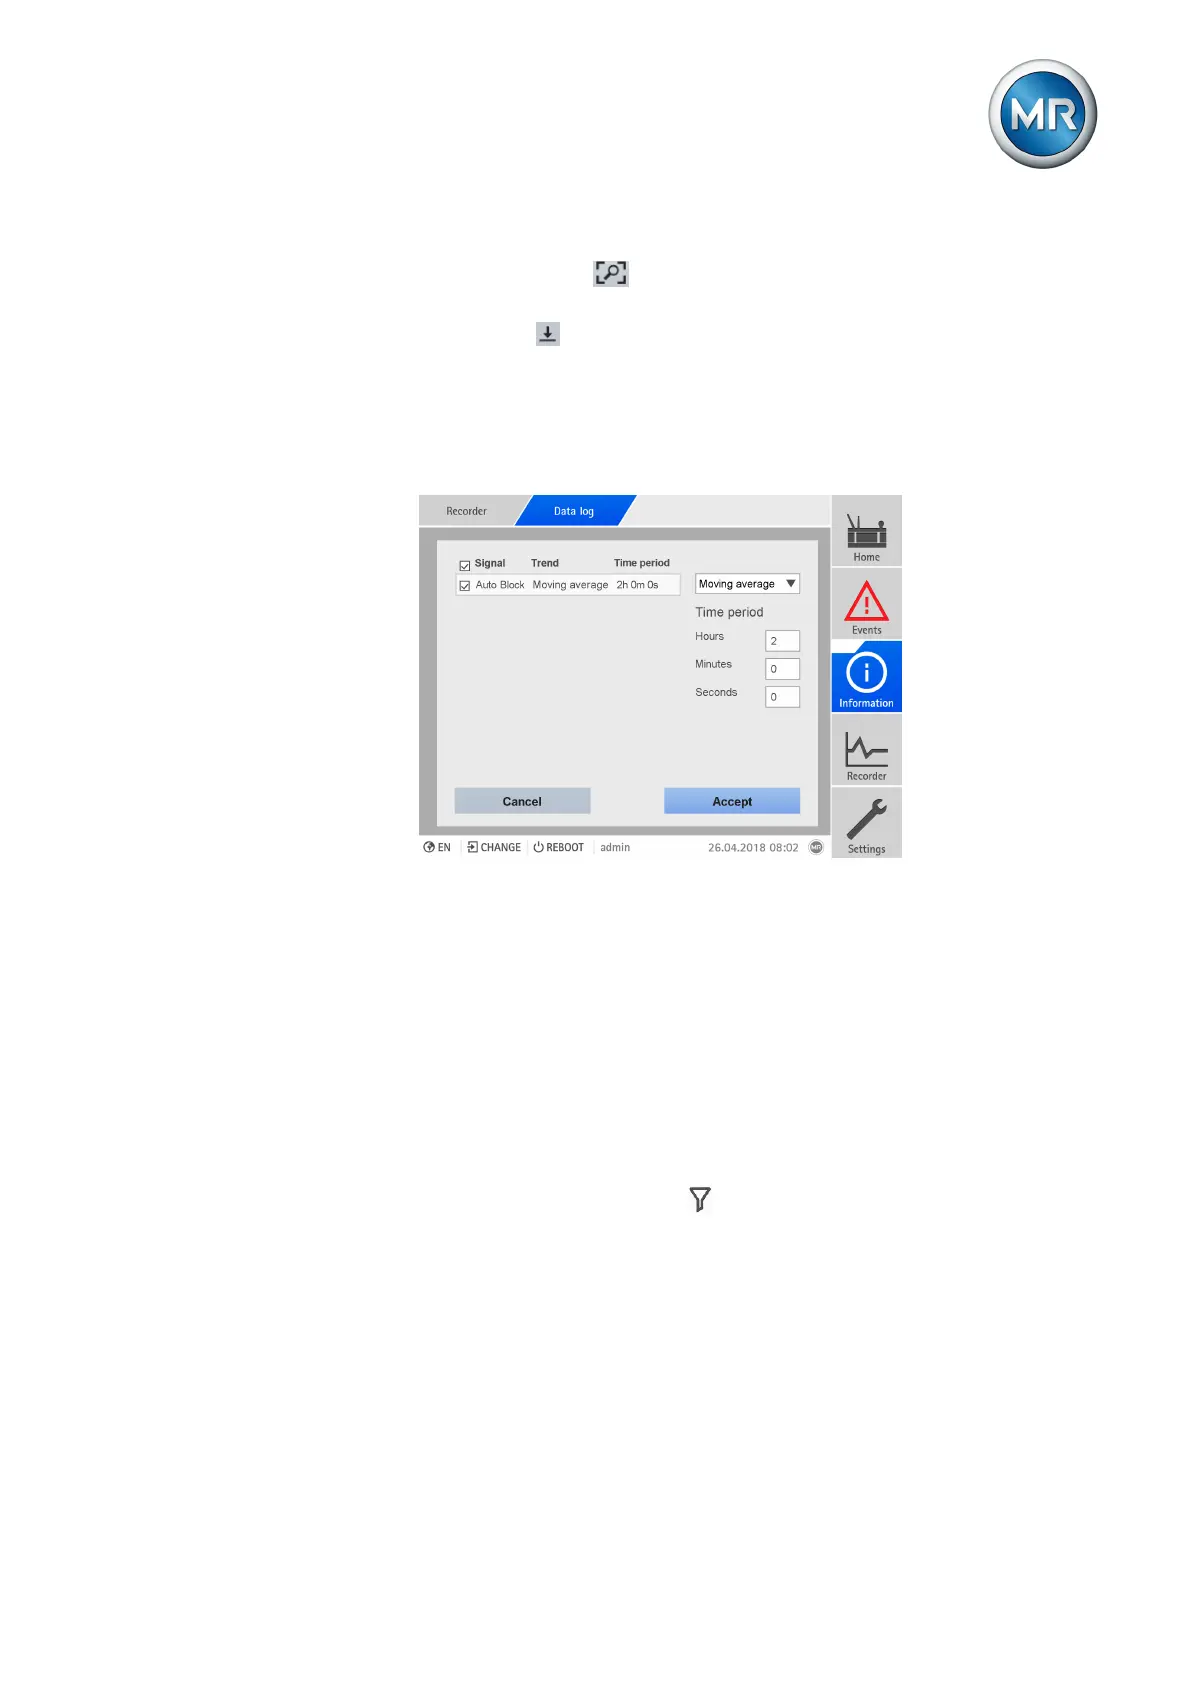
Figure122: Creating trend curves
To create the trend curves, proceed as follows:
1. Call up the measurement recorder and the desired measured value se-
ries.
2. Press the Trend button.
3. Select the desired measured values.
4. Select the desired trend function.
5. Entire the desired time period for the calculation of the trend curve.
6. Press the Accept button to display the trend curves.
ð The trend curve is displayed. Measured values that are displayed as trend
curves are marked with the symbol.
7.10.3 Setting the average value interval
You can use this parameter to set the average value interval of the mea-
sured value recorder for electrical measured variables (current, voltage,
phase angle etc.).