7 Operation
Maschinenfabrik Reinhausen GmbH 2019 2075163667/06 EN ETOS
®
IM
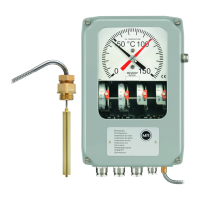
7.14.2.2 Rates of increase
You can display the calculated rates of increase of the gases (ppm/d and
ppm/y). The bar chart shows a graphical representation of the actual rate of
increase (ppm/d) and the set limit values (yellow, red). The set evaluation in-
terval is the decisive factor for the display of rates of increase.
Figure153: Displaying the rates of increase
To display the rates of increase, proceed as follows:
► Go to Information > DGA > Rates of increase.
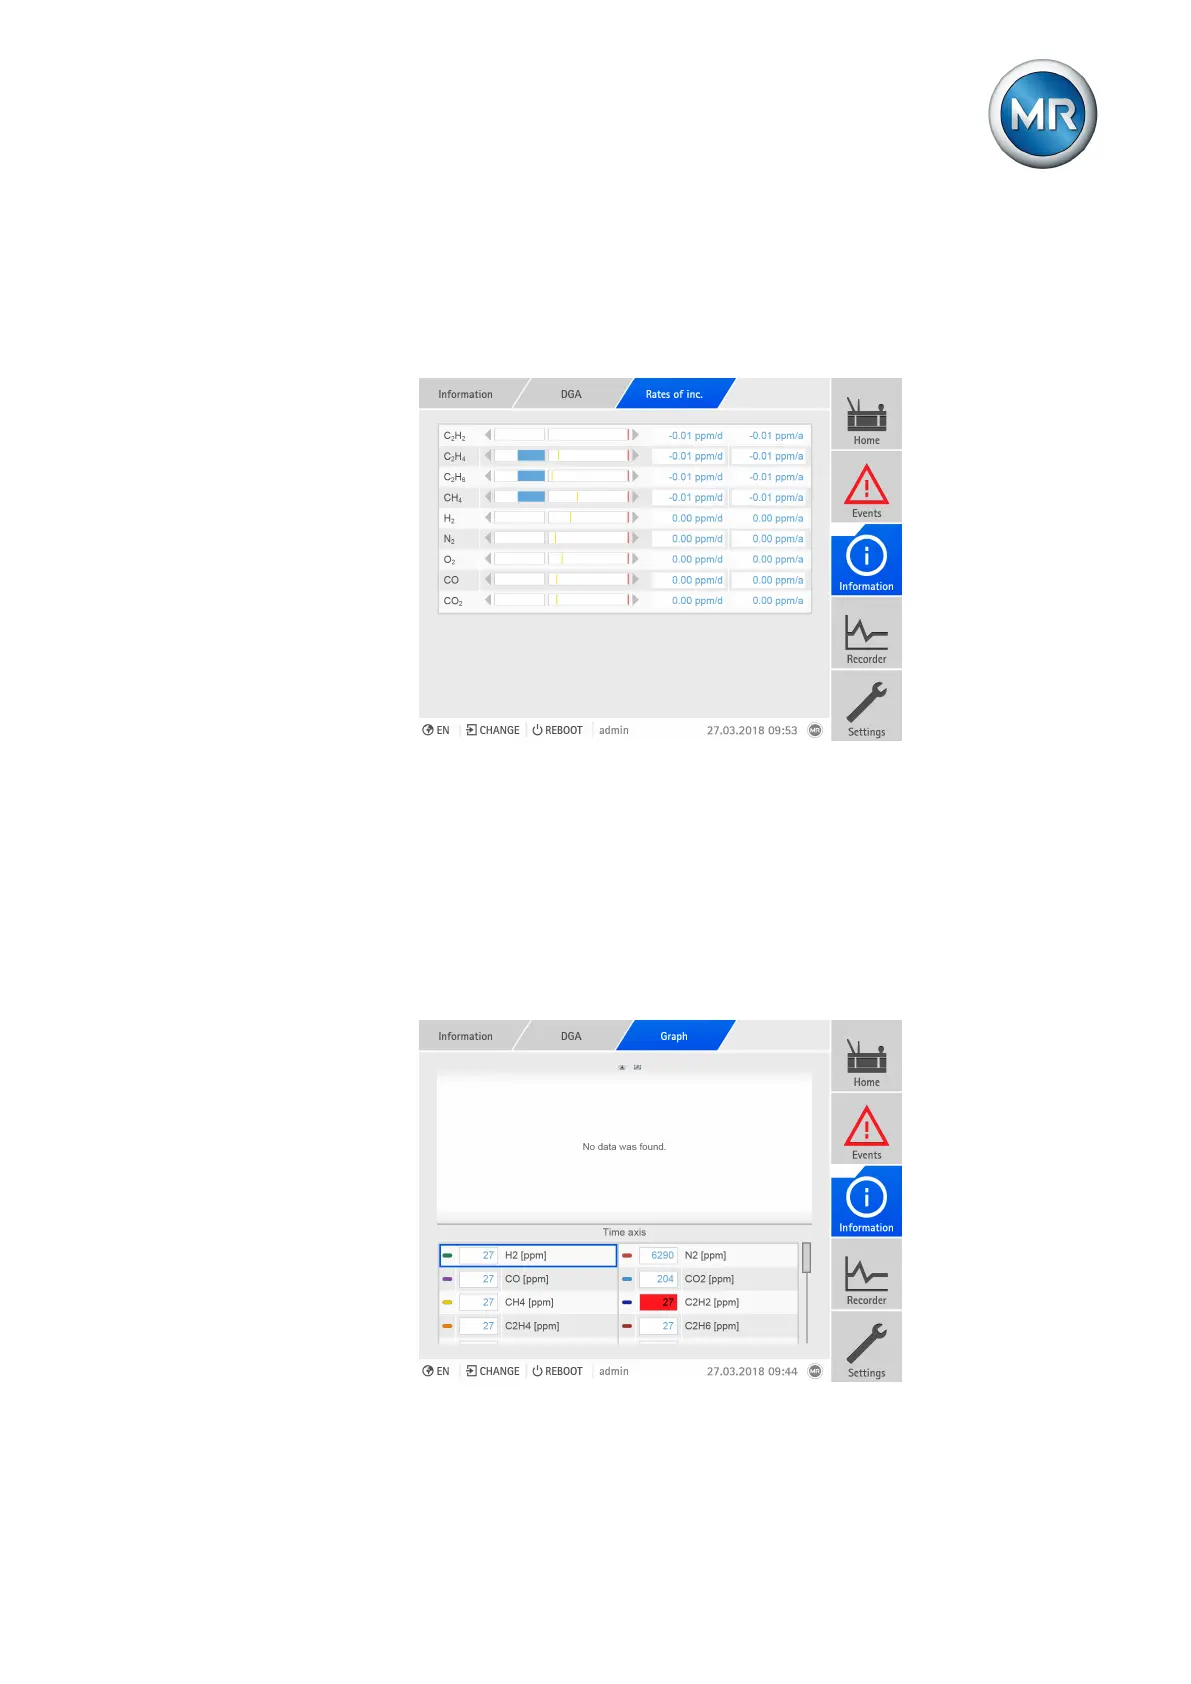
7.14.2.3 Measured value trend
You can display the temporal progression of the measured DGA measure-
ments over the last 10 days. To do so, proceed as follows:
► Go to Information > DGA > Graph.
Figure154: DGA measured value trend
 Loading...