7 Operation
Maschinenfabrik Reinhausen GmbH 2019208 5163667/06 ENETOS
®
IM
You can also display the DGA measured value trend over a time period that
you define. You will find more information on this in the section "Measured
value recorder" [►Section 7.10.2, Page 169].
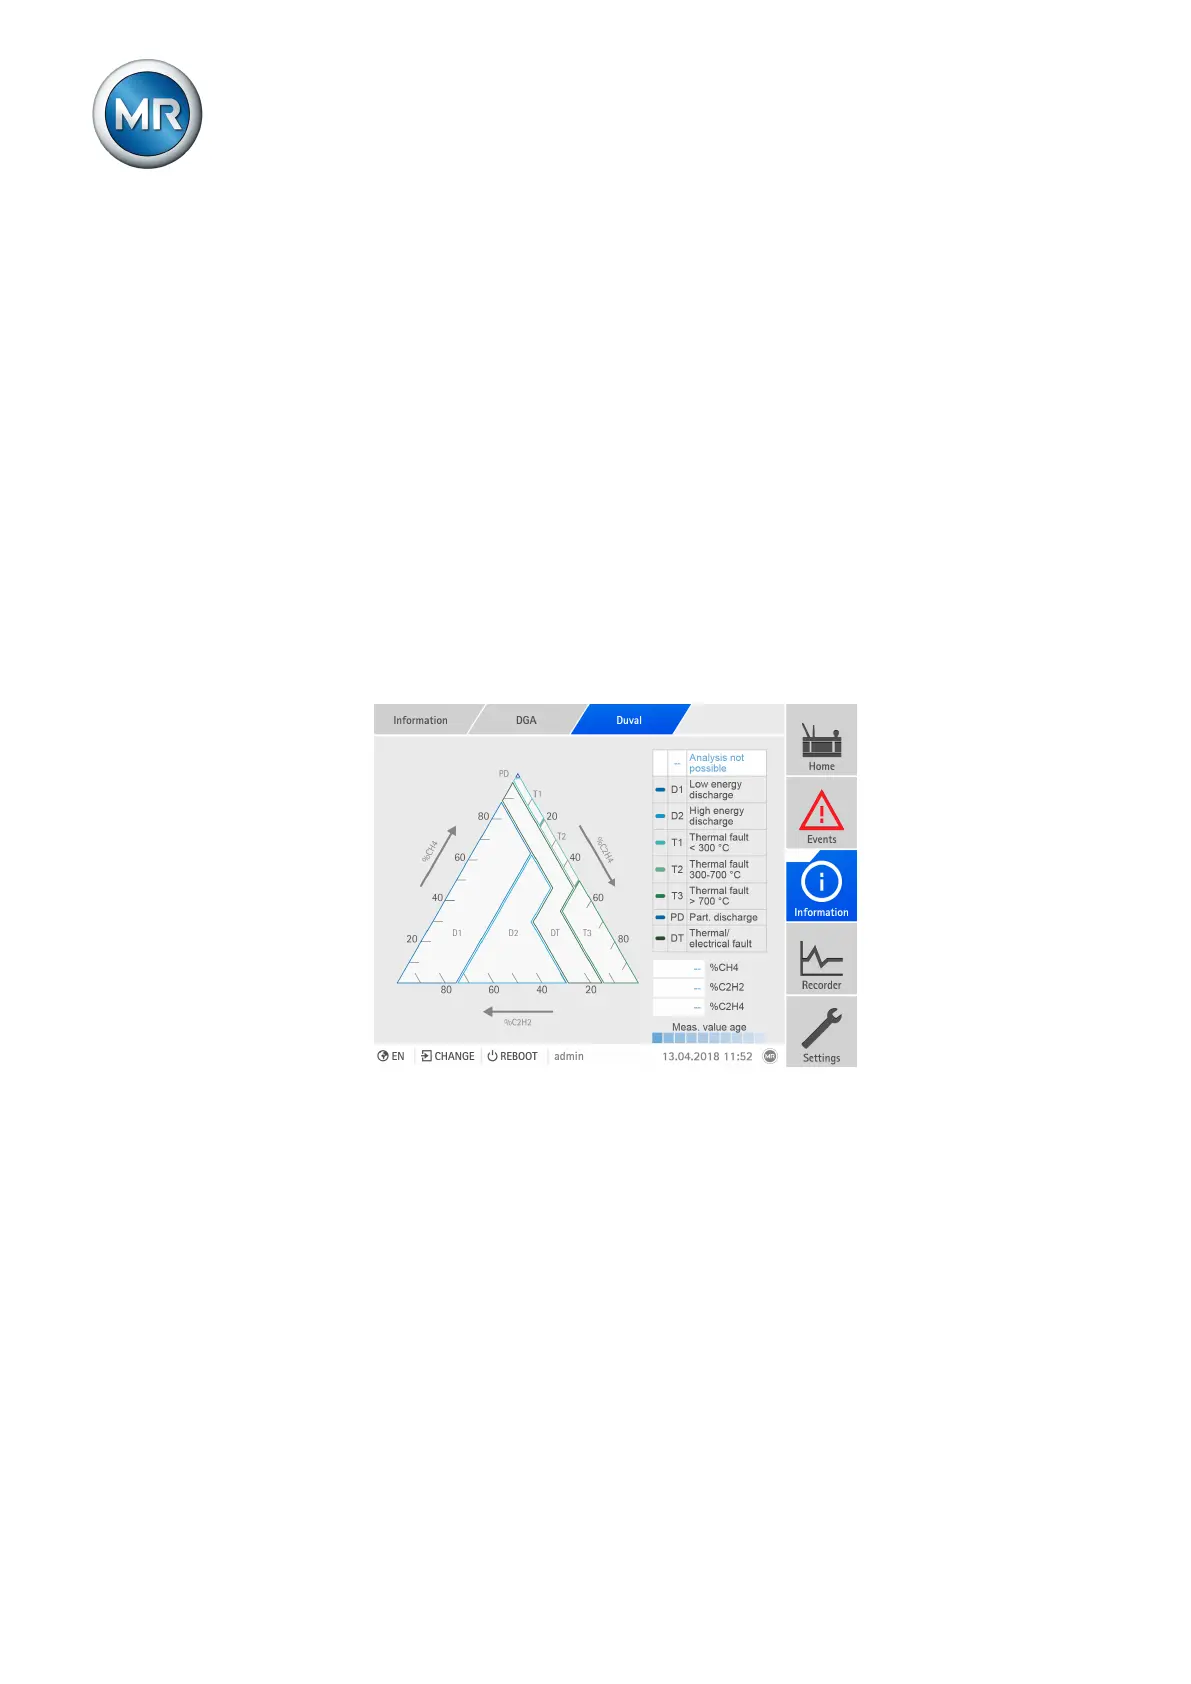
7.14.2.4 Duval analysis
The display of the Duval analysis shows the following information:
▪ Duval triangle, with the allocation of the last 10 measured values in the ar-
eas of the various error types.
– Latest measured value: darkest area with a display of the measurement
error.
– Earliest measured value: lightest area
▪ Display of the error types. The error type of the latest measured value is
highlighted in white.
▪ Gas concentrations of the latest measured value
If you call up the visualization using a PC, the gas concentrations and the
time of the measurement are displayed for each measured value via tooltip.
Figure155: Display of the Duval analysis
To display the Duval analysis, proceed as follows:
► Go to Information > DGA > Duval.
7.14.2.5 Rogers analysis
The display of the Rogers analysis shows the following information:
▪ 3D diagram, with the allocation of the last 10 measured values in the ar-
eas of the various error types.
– Latest measured value: darkest area with a display of the measurement
error.
– Earliest measured value: lightest area
 Loading...