7 Operation
Maschinenfabrik Reinhausen GmbH 2019 2095163667/06 EN ETOS
®
IM
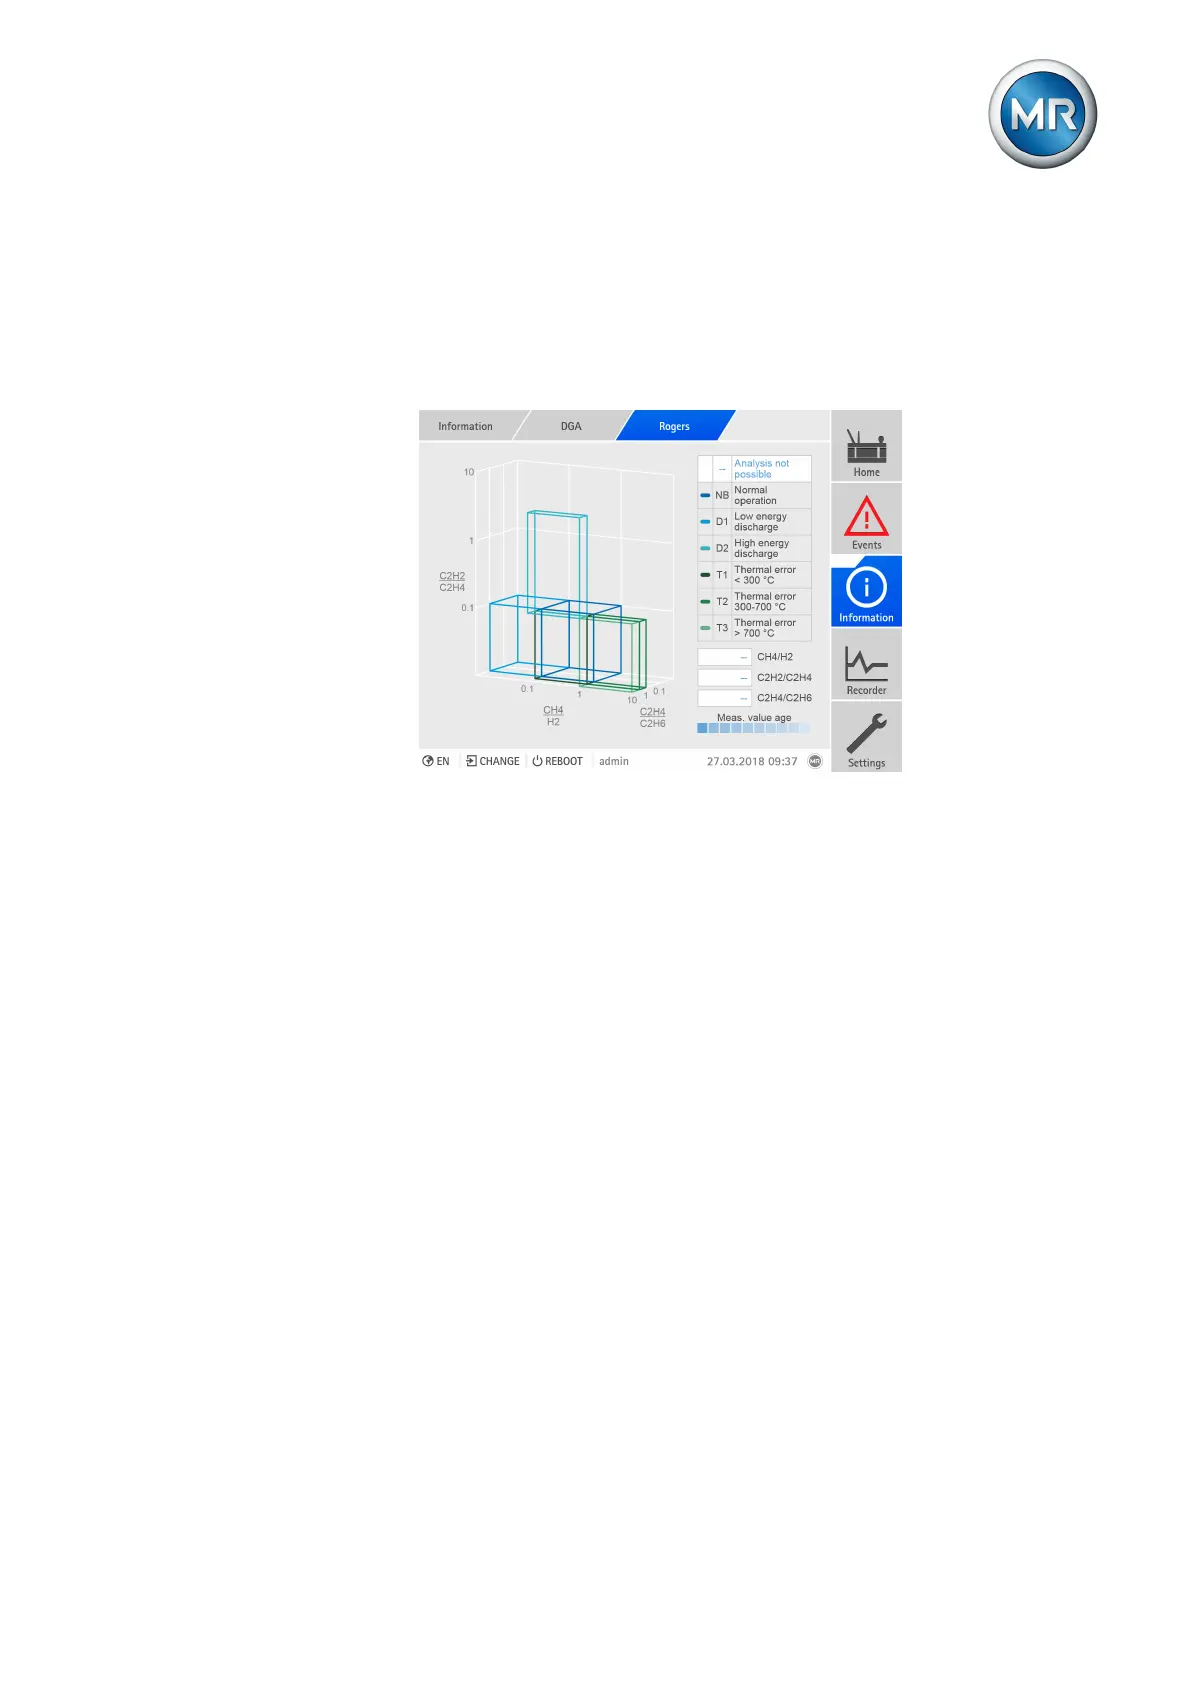
▪ Display of the error types. The error type of the latest measured value is
highlighted in white.
▪ Proportion of the gas concentrations of the latest measured value
If you call up the visualization using a PC, the proportions of the gas concen-
trations and the time of the measurement are displayed for each measured
value via tooltip. Furthermore, you can rotate the diagram using the mouse.
Figure156: Display of the Rogers analysis
To display the Rogers analysis, proceed as follows:
► Go to Information > DGA > Rogers.
7.14.2.6 Dörnenburg analysis
The display of the Dörnenburg analysis shows the following information:
▪ Tabular display of the latest 10 errors
▪ Display of the error types. The error type of the latest measured value is
highlighted in white.
▪ Proportion of the gas concentrations of the latest measured value
 Loading...