7 Operation
Maschinenfabrik Reinhausen GmbH 2019210 5163667/06 ENETOS
®
IM
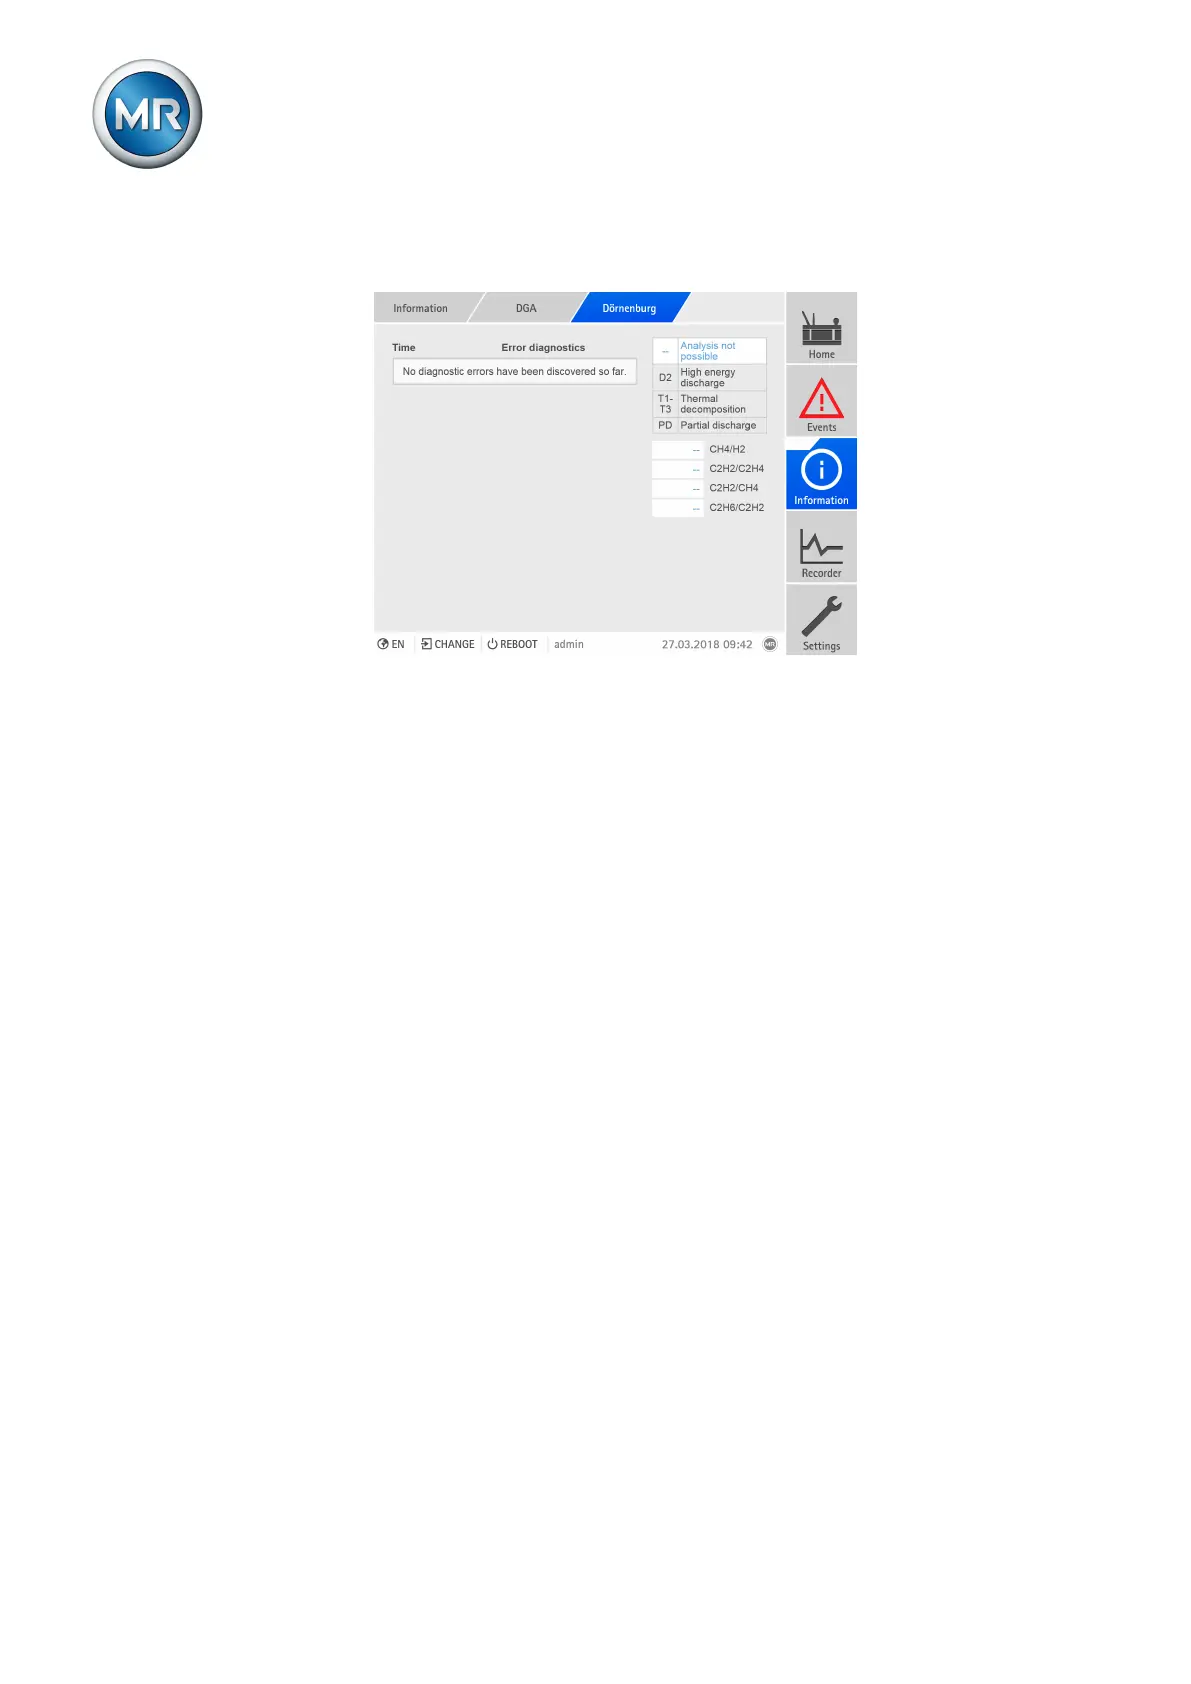
If you call up the visualization using a PC, the proportions of the gas concen-
trations are displayed for each measured value via tooltip.
Figure157: Display of the Dörnenburg analysis
To display the Dörnenburg analysis, proceed as follows:
► Go to Information > DGA > Dörnenburg.
7.14.2.7 IEC 60599 analysis
The display of the IEC 60599 analysis shows the following information:
▪ 3D diagram, with the allocation of the last 10 measured values in the ar-
eas of the various error types.
– Latest measured value: darkest area with a display of the measurement
error.
– Earliest measured value: lightest area
▪ Display of the error types. The error type of the latest measured value is
highlighted in white.
▪ Proportion of the gas concentrations of the latest measured value
 Loading...