S350 Series 24-Port (PoE+) and 48-Port Gigabit Ethernet Smart Managed Pro Switches
Monitor the System User Manual318
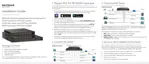
To view or clear the event log:
1. Connect your computer to the same network as the switch.
You can use a WiFi or wired connection to connect your computer to the network, or
connect directly to a switch that is off-network using an Ethernet cable.
2. Launch a web browser.
3. In the address field of your web browser, enter the IP address of the switch.
If you do not know the IP address of the switch, see
Discover or Change the Switch IP
Address on page 12.
The login window opens.
4. Enter the switch’s password in the Password field.
The default password is
password.
The System Information page displays.
5. Select Monitoring > Logs > Event Logs.
6. To refresh the page with the latest information about the switch, click the Refresh button.
7. To clear the messages from the event logs in the memory, click the Clear button.
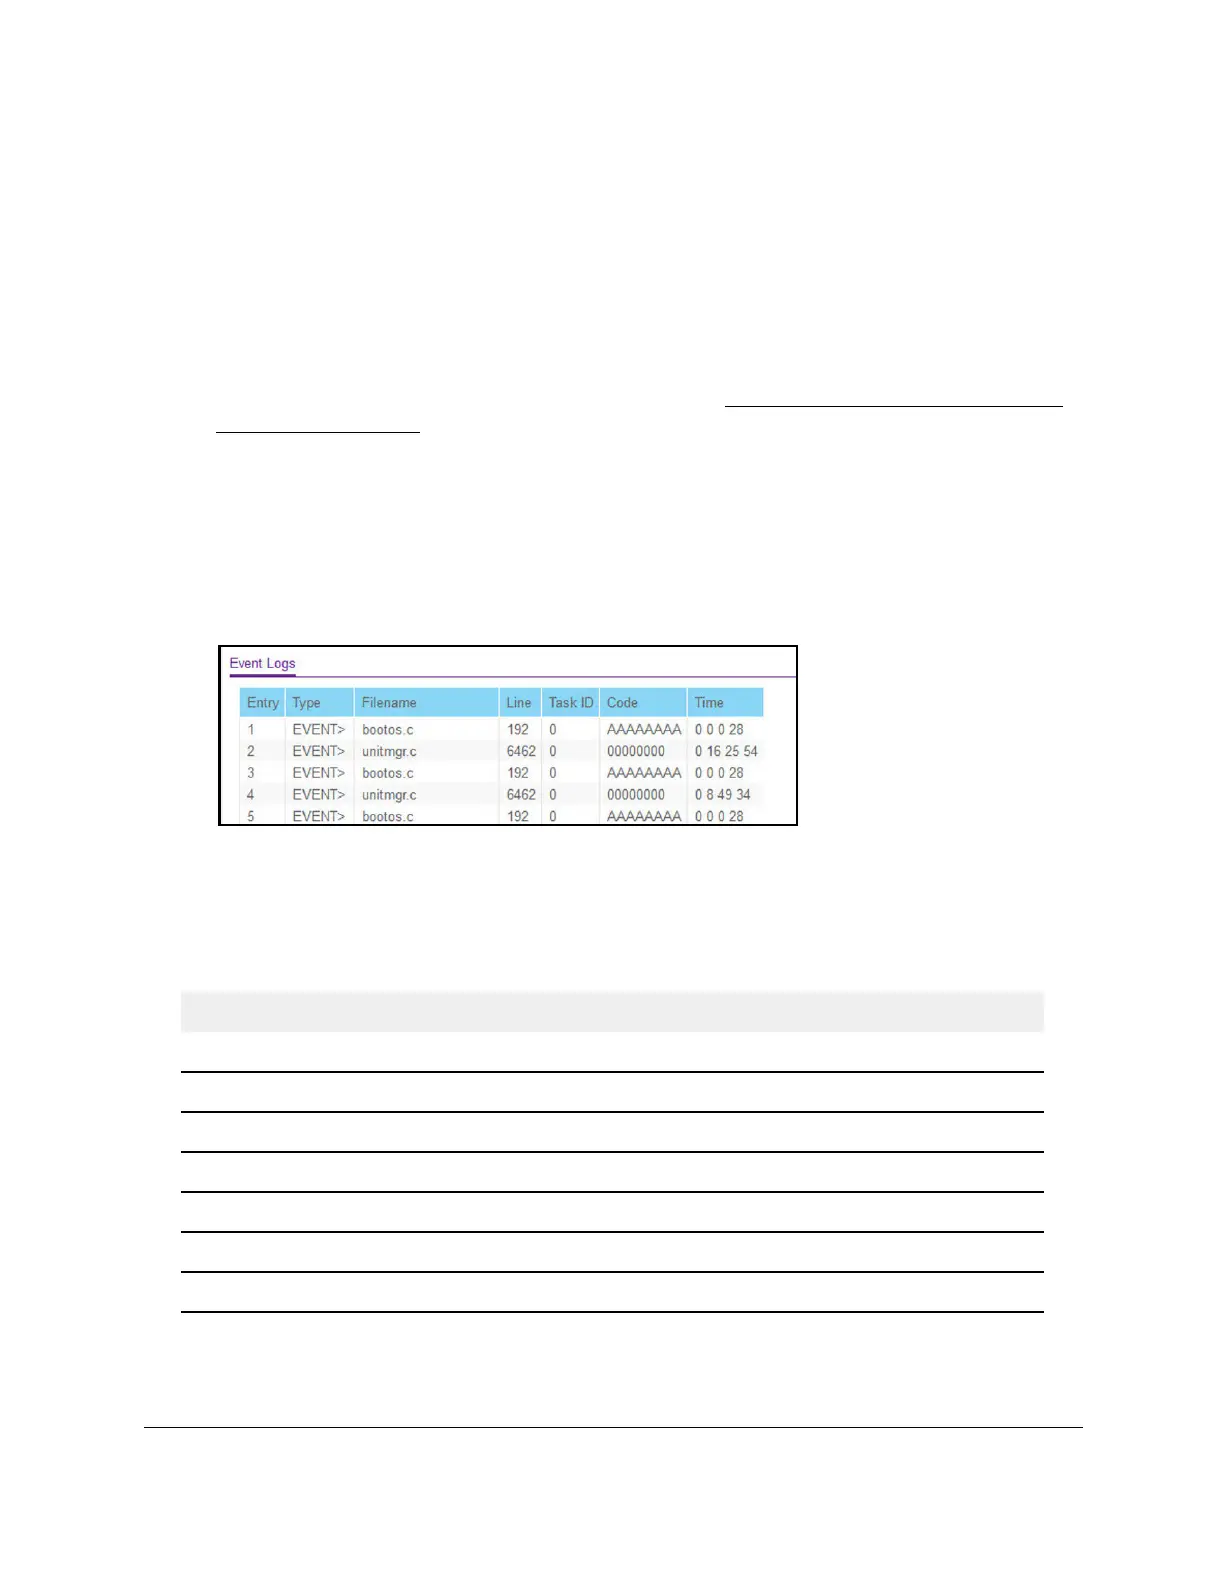
The following table describes the event log information that is displayed on the page.
Table 71. Event Logs information
Field Description
Entry The sequence number of the event.
Type The type of the event.
File Name The file in which the event originated.
Line The line number of the event.
Task Id The task ID of the event.
Code The event code.
Time The time this event occurred.
 Loading...