Operation
44 900-0117-01-00 Rev B
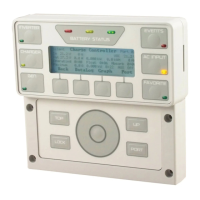
From the
Inverter
screen (see
24
Figure 23 on page
24
40), the
<Graph>
soft key brings up the following
screens which plot various type of data over time. The first screen shows changes in wattage produced by
the inverter over time.
Figure 32 Inverter Graph
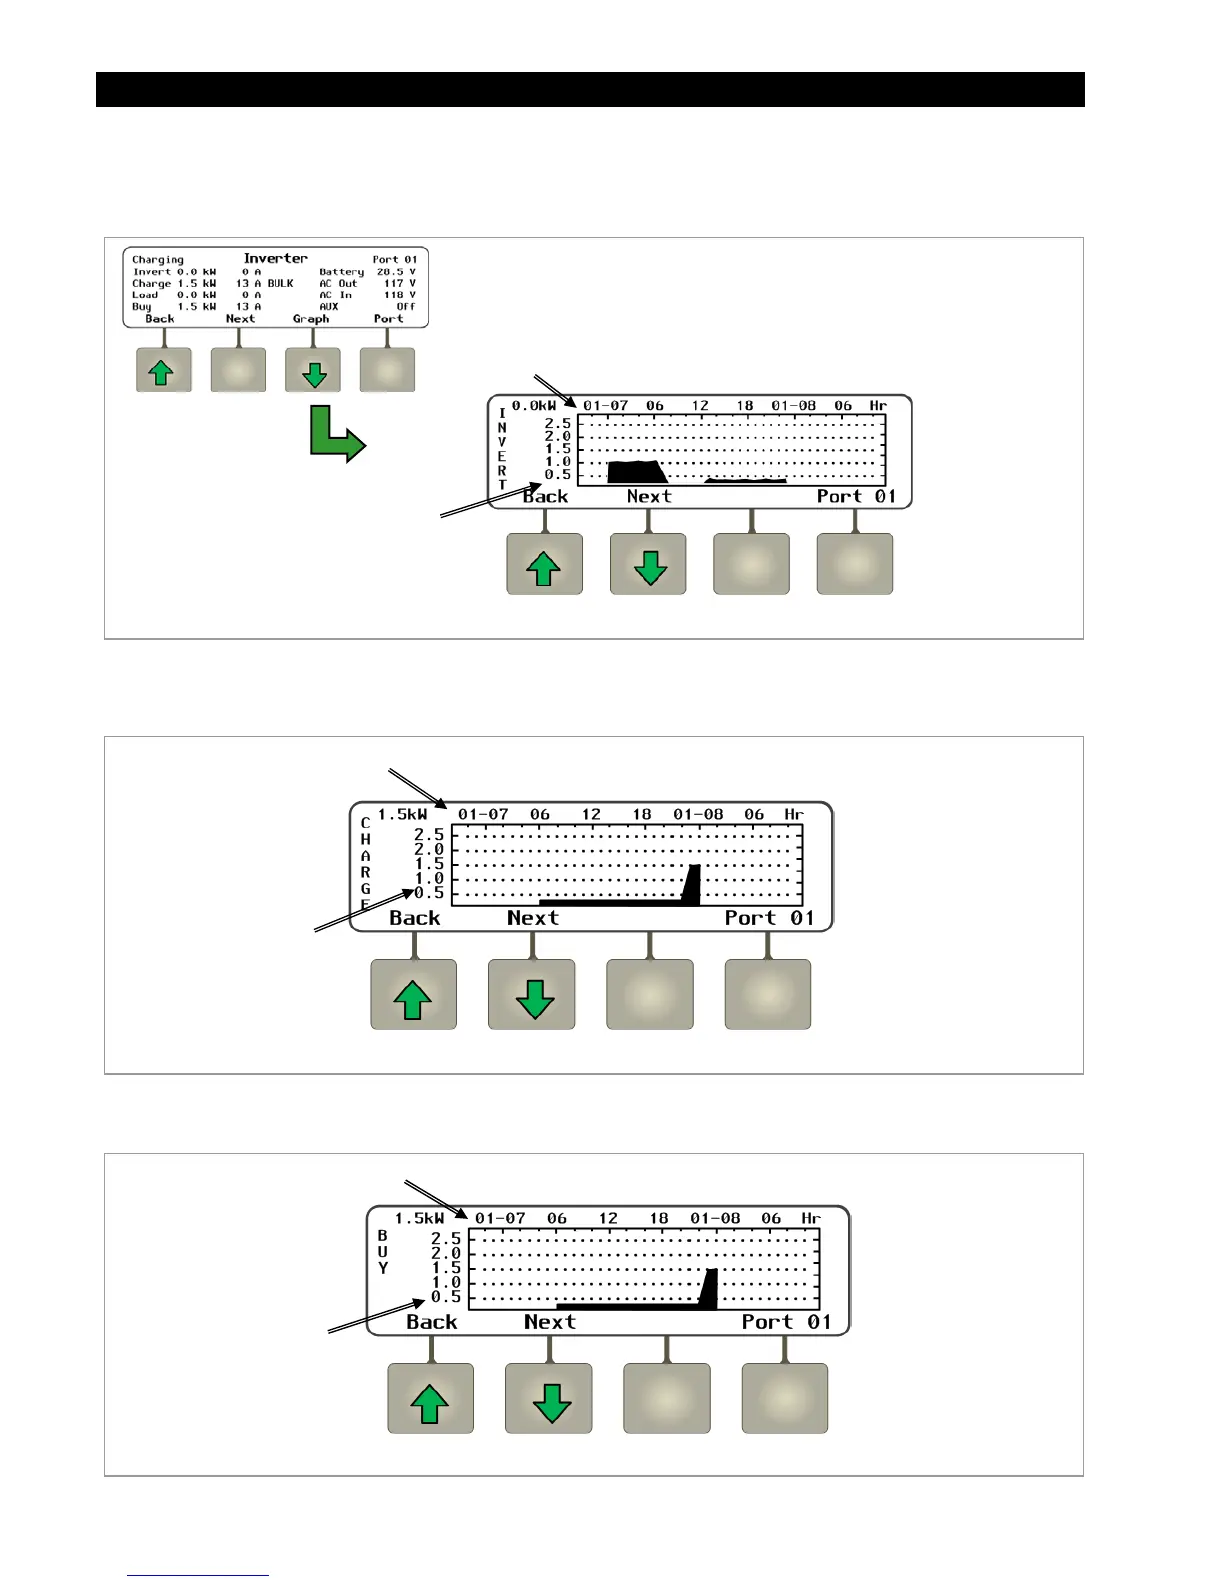
The
<Next>
soft key brings up a screen which shows changes in wattage produced by the battery charger
over time.
Figure 33 Charge Graph
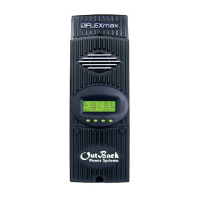
The
<Next>
soft key brings up a screen which shows changes in wattage imported (bought) by the
inverter system from an AC source over time.
Figure 34 Buy Graph
This axis shows date and time
in 6-hour increments.
This axis shows
inverter wattage.
This axis shows
charger wattage.
his axis shows date and time
in 6-hour increments.
This axis shows
imported wattage.
This axis shows date and time
in 6-hour increments.