Operation
900-0117-01-00 Rev B 45
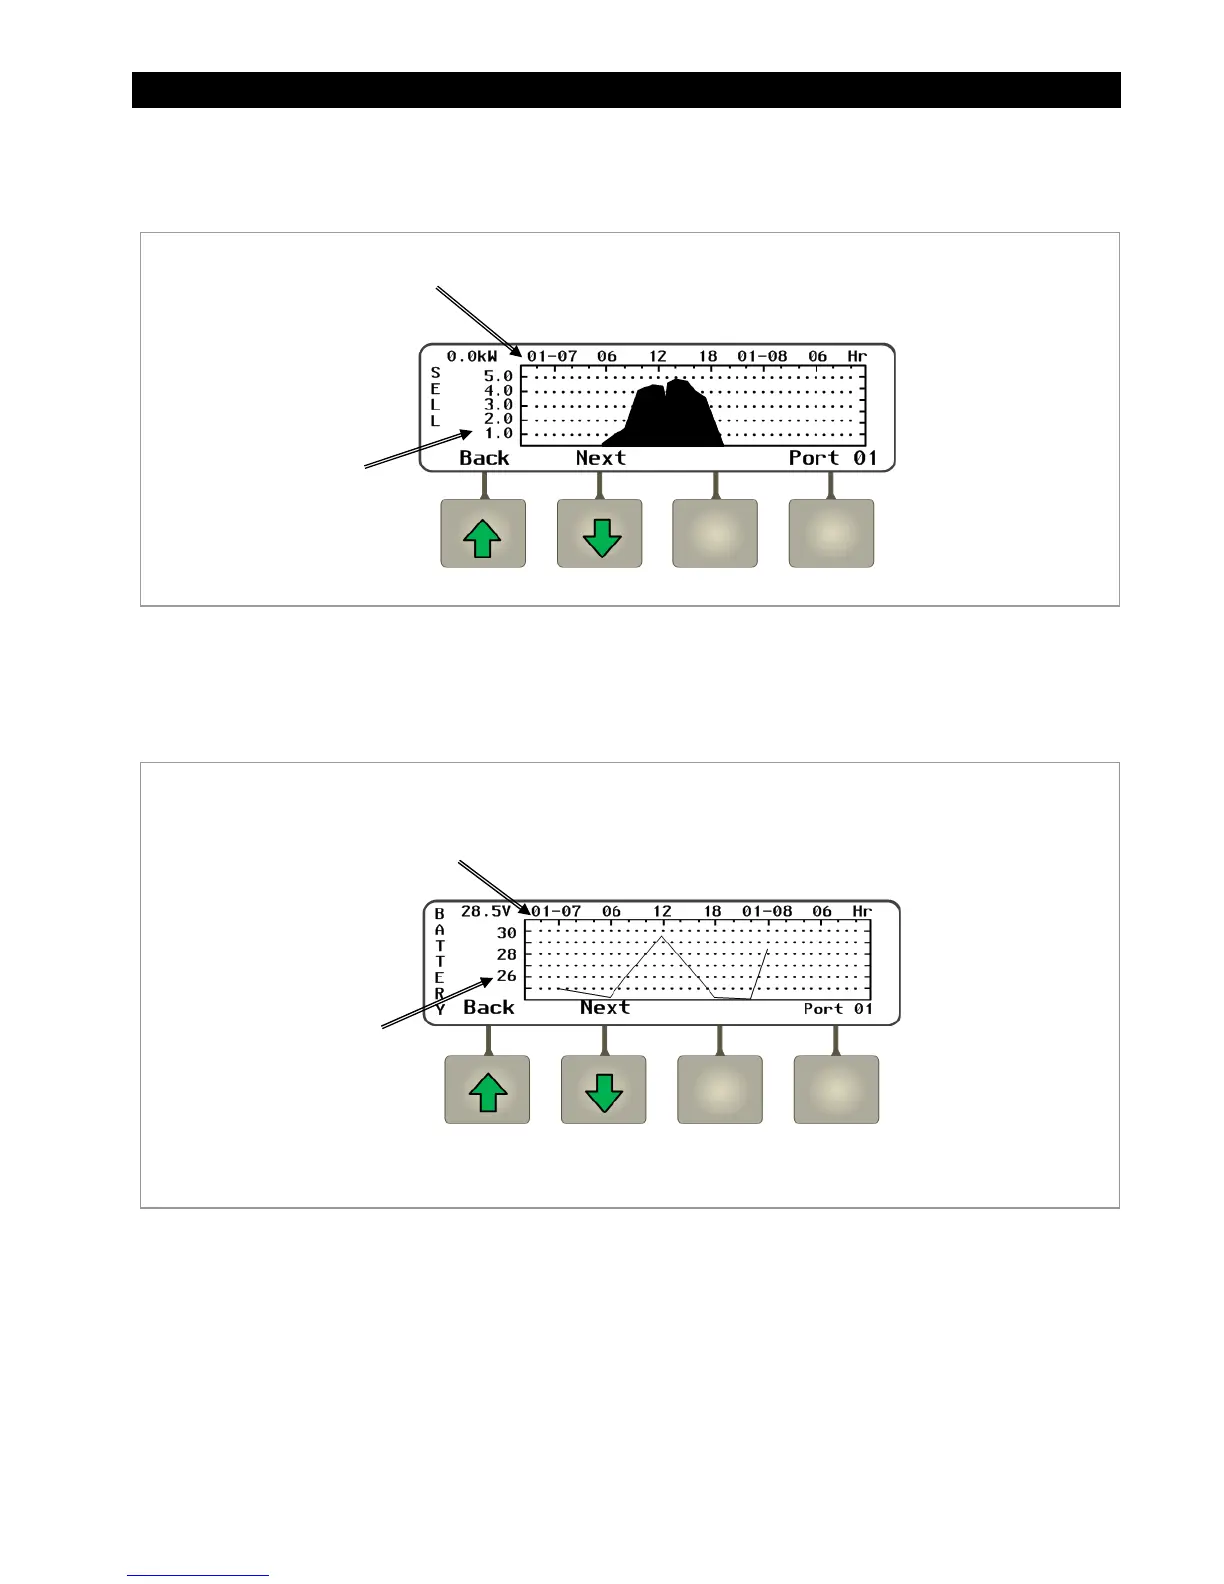
The
<Next>
soft key brings up a screen which shows changes in wattage sold to the utility by a
grid-interactive system over time.
Figure 35 Sell Graph
The <Next> soft key brings up a graph showing changes in battery voltage over time. This graph may be
used by other soft keys.
Figure 36 Battery Graph
Continuing to press the <Next> soft key will proceed through the same graphs again from the beginning.
This axis shows
sold wattage.
This axis shows date and time
in 6-hour increments.
This axis shows
battery voltage.
This axis shows date and time
in 6-hour increments.