2–Managing Fabrics
Transparent Routes Data Window
59266-01 B 2-23
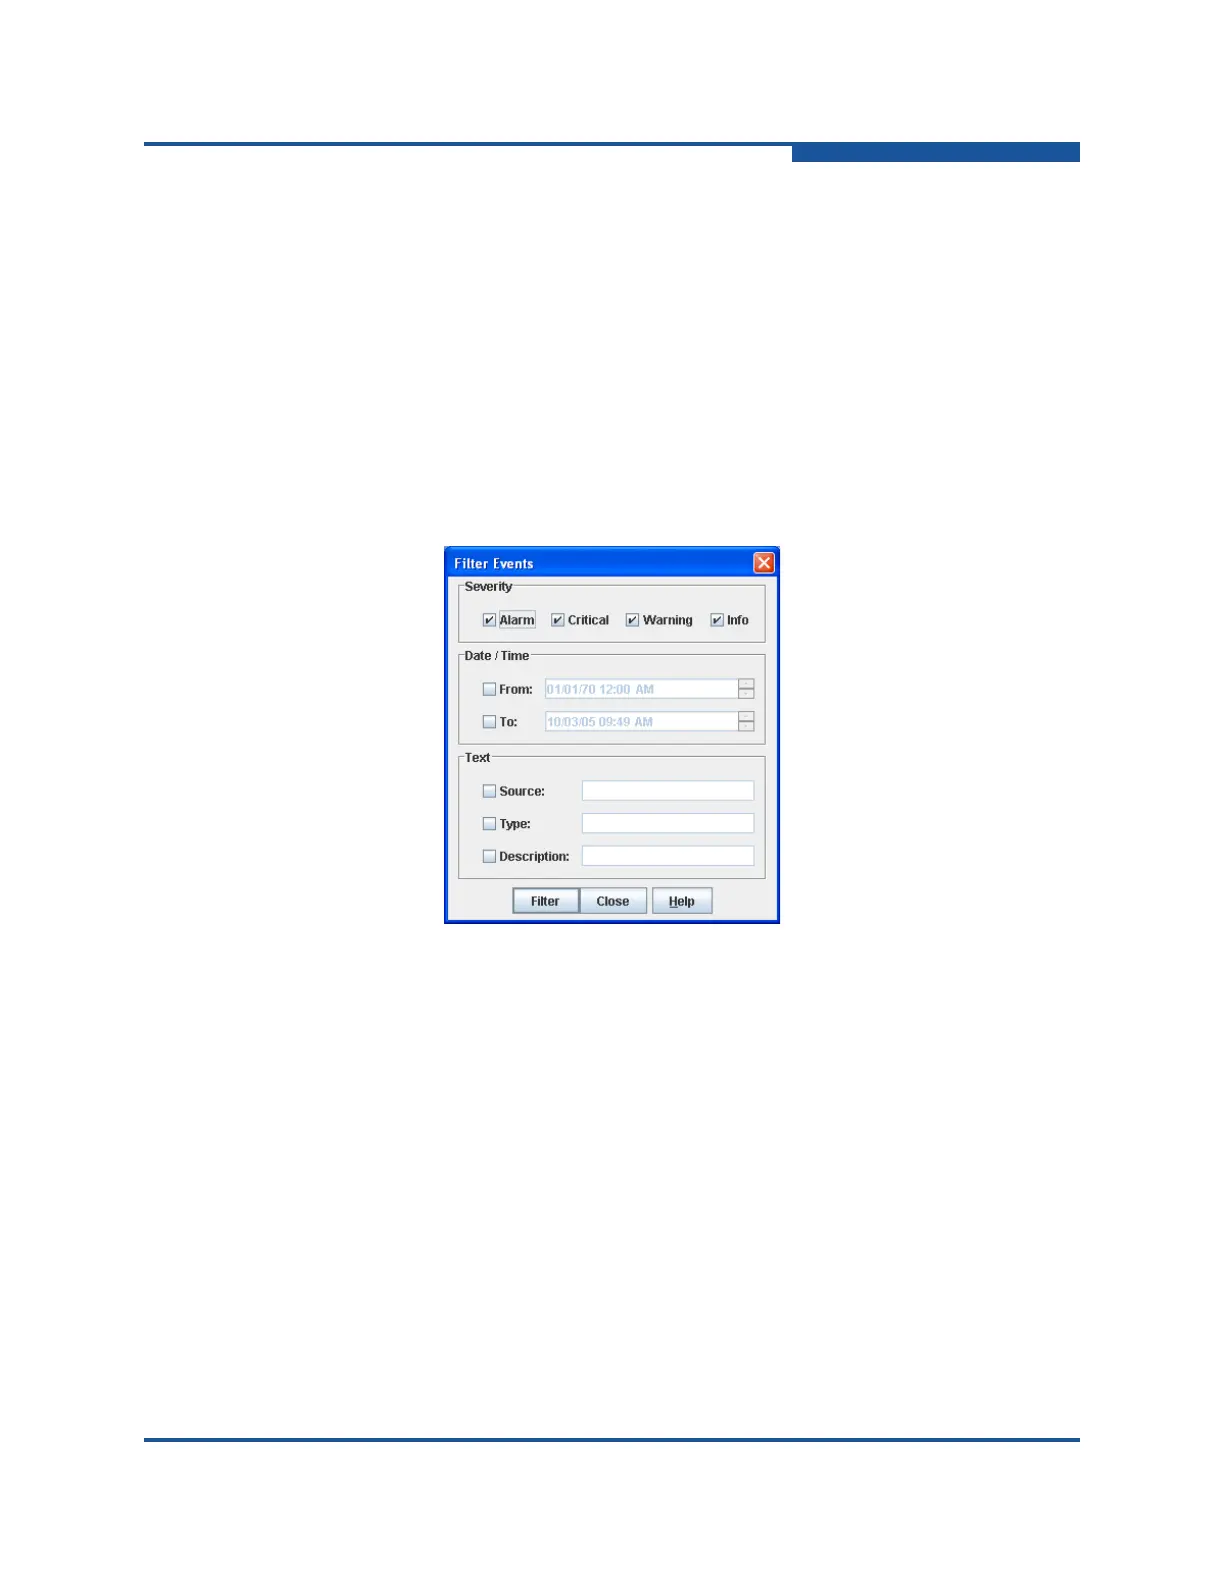
You can filter the Event Browser in the following ways:
Severity—select one or more of the corresponding options to display:
alarm, critical, warning, or informative events.
Date/Time—select one or both of the From: and To: options, and enter the
bounding timestamps (MM/DD/YY HH:MM:SS AA, where "AA" indicates AM
or PM) to display only those events that fall within the selected times. The
current year (YY) can be entered as either 2 or 4 digits.
Text—select one or more of the corresponding options and enter a text
string (case sensitive) identifying the source, type, and description of the
events to be monitored. The Event Browser displays only those events that
satisfy all of the search specifications for the criteria defined.
Figure 2-10. Filter Events Dialog Box
Sorting the Event Browser
Sorting the Event Browser enables you to display the events in alphanumeric
order based on the event severity, timestamp, source, type, or description. By
default, the Event Browser is sorted in ascending order by timestamp. To sort on
another column of the Event Browser, click the Severity, Timestamp, Source,
Type, or Description column button. Or, on the Sort menu, click By Severity, By
Timestamp, By Source, By Type, or By Description. Successive sort
operations of the same type alternate between ascending and descending order.
Saving the Event Browser to a File
You can save the displayed Event Browser entries to a file. Filtering affects the
save operation, because only displayed events are saved. To save the Event
Browser to a file:
 Loading...